放置色块
色标表示图像数据的定量范围。放置在一个图中并不重要,因为需要为它们腾出空间。
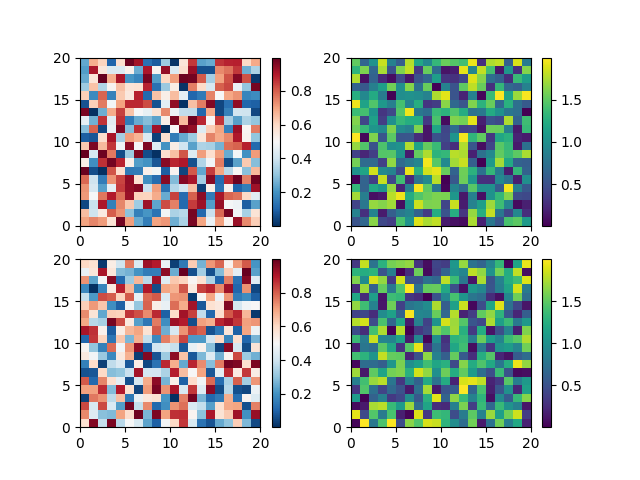
最简单的情况是将颜色条附加到每个轴:
import matplotlib.pyplot as pltimport numpy as npfig, axs = plt.subplots(2, 2)cm = ['RdBu_r', 'viridis']for col in range(2):for row in range(2):ax = axs[row, col]pcm = ax.pcolormesh(np.random.random((20, 20)) * (col + 1),cmap=cm[col])fig.colorbar(pcm, ax=ax)plt.show()
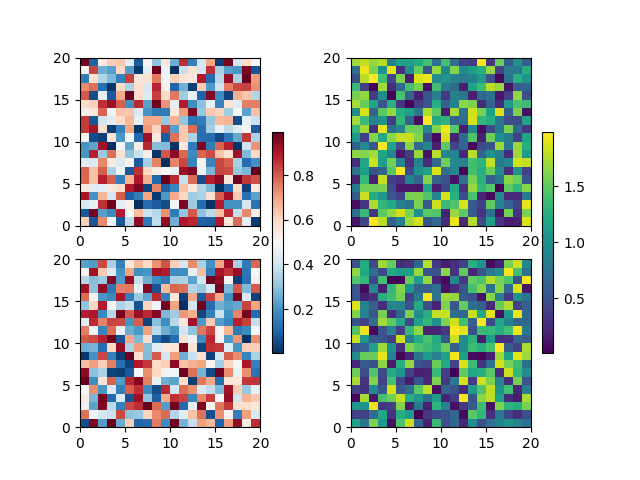
第一列在两行中都具有相同类型的数据,因此可能需要通过调用 Figure.colorbar 和轴列表而不是单个轴来组合我们所做的颜色栏。
fig, axs = plt.subplots(2, 2)cm = ['RdBu_r', 'viridis']for col in range(2):for row in range(2):ax = axs[row, col]pcm = ax.pcolormesh(np.random.random((20, 20)) * (col + 1),cmap=cm[col])fig.colorbar(pcm, ax=axs[:, col], shrink=0.6)plt.show()
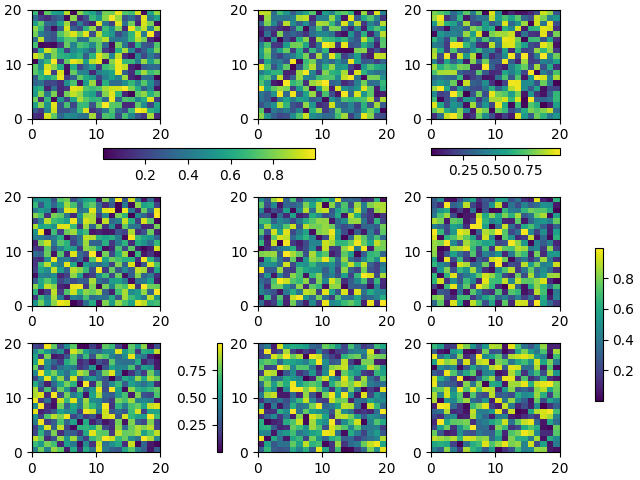
使用此范例可以实现相对复杂的颜色条布局。请注意,此示例使用 constrained_layout = True 可以更好地工作
fig, axs = plt.subplots(3, 3, constrained_layout=True)for ax in axs.flat:pcm = ax.pcolormesh(np.random.random((20, 20)))fig.colorbar(pcm, ax=axs[0, :2], shrink=0.6, location='bottom')fig.colorbar(pcm, ax=[axs[0, 2]], location='bottom')fig.colorbar(pcm, ax=axs[1:, :], location='right', shrink=0.6)fig.colorbar(pcm, ax=[axs[2, 1]], location='left')plt.show()
下载这个示例

若有收获,就点个赞吧
0 人点赞
