多外形演示
使用多个图形窗口和子图形。
import matplotlib.pyplot as pltimport numpy as npt = np.arange(0.0, 2.0, 0.01)s1 = np.sin(2*np.pi*t)s2 = np.sin(4*np.pi*t)
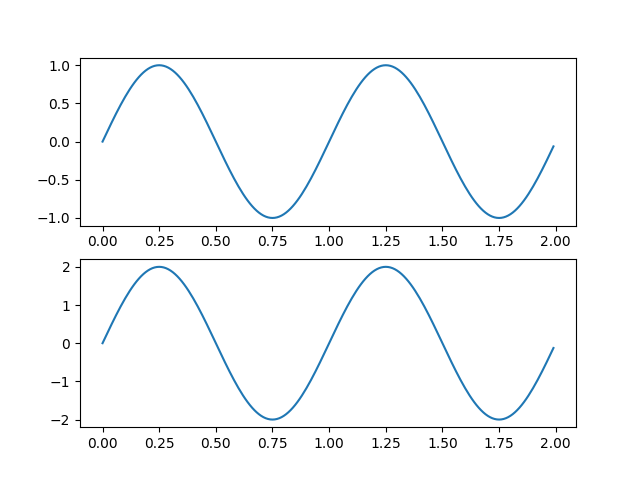
Create figure 1
plt.figure(1)plt.subplot(211)plt.plot(t, s1)plt.subplot(212)plt.plot(t, 2*s1)
Create figure 2
plt.figure(2)plt.plot(t, s2)
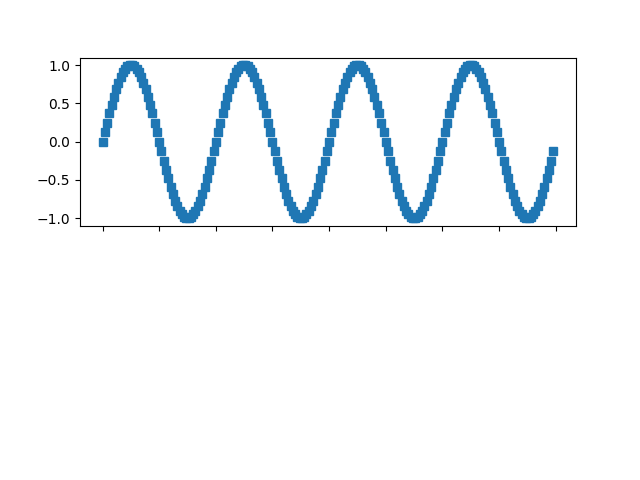
Now switch back to figure 1 and make some changes
plt.figure(1)plt.subplot(211)plt.plot(t, s2, 's')ax = plt.gca()ax.set_xticklabels([])plt.show()
下载这个示例

若有收获,就点个赞吧
0 人点赞
