椭圆与单位
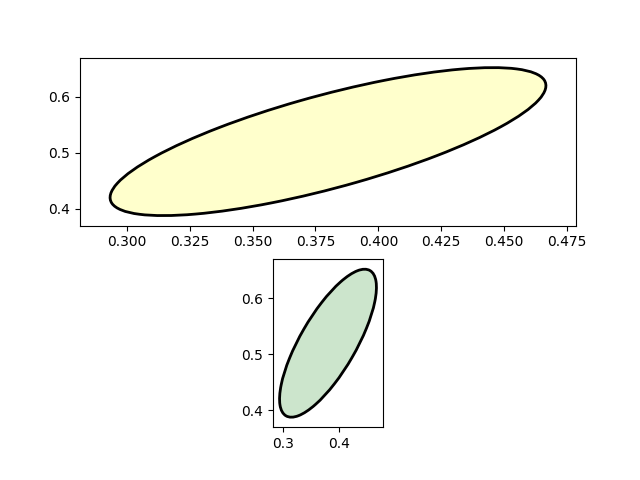
比较用弧形生成的椭圆与多边形近似
此示例需要 basic_units.py
from basic_units import cmimport numpy as npfrom matplotlib import patchesimport matplotlib.pyplot as pltxcenter, ycenter = 0.38*cm, 0.52*cmwidth, height = 1e-1*cm, 3e-1*cmangle = -30theta = np.deg2rad(np.arange(0.0, 360.0, 1.0))x = 0.5 * width * np.cos(theta)y = 0.5 * height * np.sin(theta)rtheta = np.radians(angle)R = np.array([[np.cos(rtheta), -np.sin(rtheta)],[np.sin(rtheta), np.cos(rtheta)],])x, y = np.dot(R, np.array([x, y]))x += xcentery += ycenter
fig = plt.figure()ax = fig.add_subplot(211, aspect='auto')ax.fill(x, y, alpha=0.2, facecolor='yellow',edgecolor='yellow', linewidth=1, zorder=1)e1 = patches.Ellipse((xcenter, ycenter), width, height,angle=angle, linewidth=2, fill=False, zorder=2)ax.add_patch(e1)ax = fig.add_subplot(212, aspect='equal')ax.fill(x, y, alpha=0.2, facecolor='green', edgecolor='green', zorder=1)e2 = patches.Ellipse((xcenter, ycenter), width, height,angle=angle, linewidth=2, fill=False, zorder=2)ax.add_patch(e2)fig.savefig('ellipse_compare')

fig = plt.figure()ax = fig.add_subplot(211, aspect='auto')ax.fill(x, y, alpha=0.2, facecolor='yellow',edgecolor='yellow', linewidth=1, zorder=1)e1 = patches.Arc((xcenter, ycenter), width, height,angle=angle, linewidth=2, fill=False, zorder=2)ax.add_patch(e1)ax = fig.add_subplot(212, aspect='equal')ax.fill(x, y, alpha=0.2, facecolor='green', edgecolor='green', zorder=1)e2 = patches.Arc((xcenter, ycenter), width, height,angle=angle, linewidth=2, fill=False, zorder=2)ax.add_patch(e2)fig.savefig('arc_compare')plt.show()
下载这个示例

若有收获,就点个赞吧
0 人点赞
