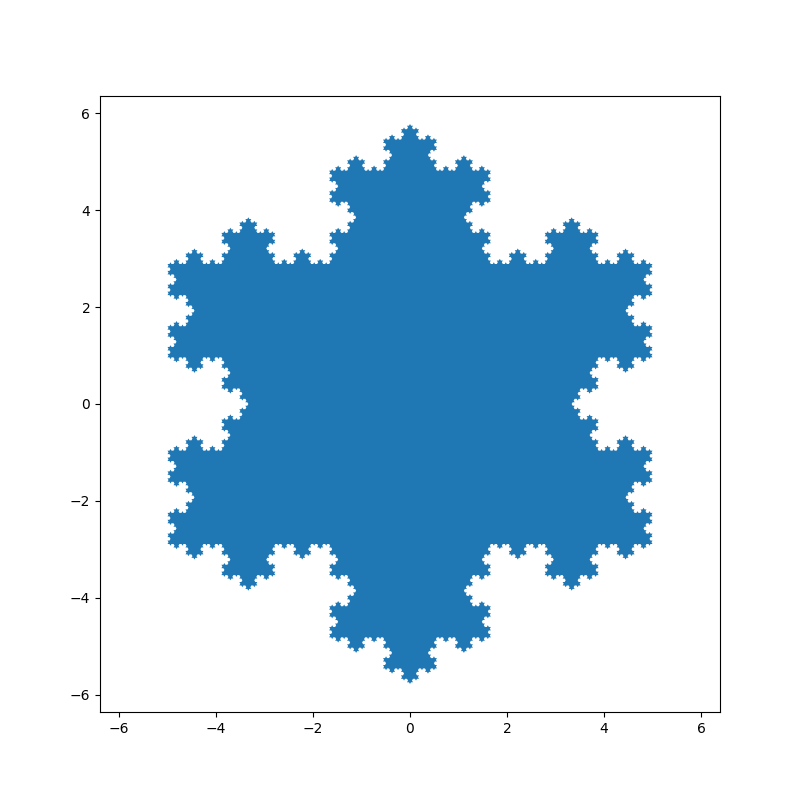
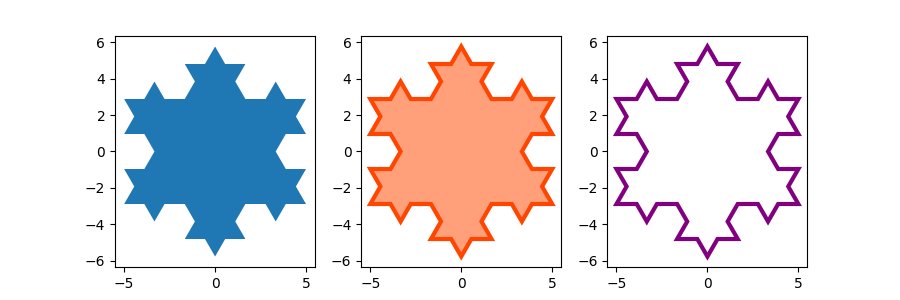
绘制填充图的示例
演示填充图。
首先,用户可以使用matplotlib制作的最基本的填充图:
import numpy as npimport matplotlib.pyplot as pltx = [0, 1, 2, 1]y = [1, 2, 1, 0]fig, ax = plt.subplots()ax.fill(x, y)plt.show()

接下来,还有一些可选功能:
- 使用单个命令的多条曲线。
- 设置填充颜色。
- 设置不透明度(alpha值)。
x = np.linspace(0, 1.5 * np.pi, 500)y1 = np.sin(x)y2 = np.sin(3 * x)fig, ax = plt.subplots()ax.fill(x, y1, 'b', x, y2, 'r', alpha=0.3)# Outline of the region we've filled inax.plot(x, y1, c='b', alpha=0.8)ax.plot(x, y2, c='r', alpha=0.8)ax.plot([x[0], x[-1]], [y1[0], y1[-1]], c='b', alpha=0.8)ax.plot([x[0], x[-1]], [y2[0], y2[-1]], c='r', alpha=0.8)plt.show()


