图例(Legend)演示
在Matplotlib中绘制图例。
在Matplotlib中有很多方法可以创建和自定义图例。 下面我们将展示一些如何操作的示例。
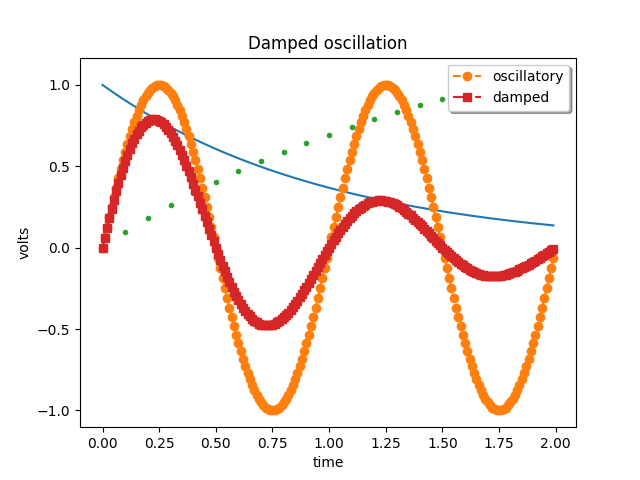
首先,我们将展示如何为特定线条制作图例。
import matplotlib.pyplot as pltimport matplotlib.collections as mcolfrom matplotlib.legend_handler import HandlerLineCollection, HandlerTuplefrom matplotlib.lines import Line2Dimport numpy as npt1 = np.arange(0.0, 2.0, 0.1)t2 = np.arange(0.0, 2.0, 0.01)fig, ax = plt.subplots()# note that plot returns a list of lines. The "l1, = plot" usage# extracts the first element of the list into l1 using tuple# unpacking. So l1 is a Line2D instance, not a sequence of linesl1, = ax.plot(t2, np.exp(-t2))l2, l3 = ax.plot(t2, np.sin(2 * np.pi * t2), '--o', t1, np.log(1 + t1), '.')l4, = ax.plot(t2, np.exp(-t2) * np.sin(2 * np.pi * t2), 's-.')ax.legend((l2, l4), ('oscillatory', 'damped'), loc='upper right', shadow=True)ax.set_xlabel('time')ax.set_ylabel('volts')ax.set_title('Damped oscillation')plt.show()
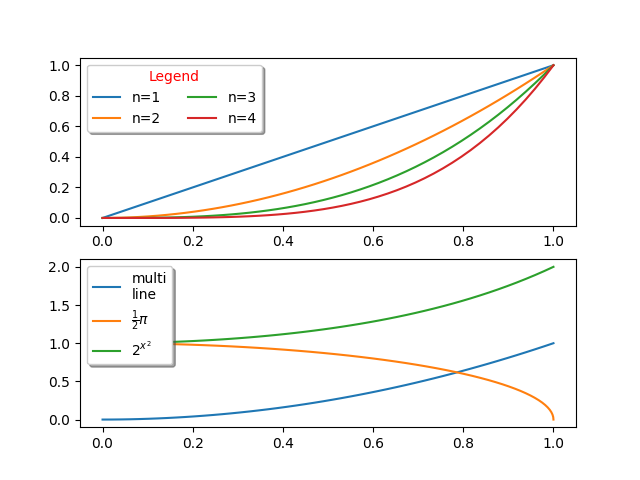
接下来,我们将演示绘制更复杂的标签。
x = np.linspace(0, 1)fig, (ax0, ax1) = plt.subplots(2, 1)# Plot the lines y=x**n for n=1..4.for n in range(1, 5):ax0.plot(x, x**n, label="n={0}".format(n))leg = ax0.legend(loc="upper left", bbox_to_anchor=[0, 1],ncol=2, shadow=True, title="Legend", fancybox=True)leg.get_title().set_color("red")# Demonstrate some more complex labels.ax1.plot(x, x**2, label="multi\nline")half_pi = np.linspace(0, np.pi / 2)ax1.plot(np.sin(half_pi), np.cos(half_pi), label=r"$\frac{1}{2}\pi$")ax1.plot(x, 2**(x**2), label="$2^{x^2}$")ax1.legend(shadow=True, fancybox=True)plt.show()
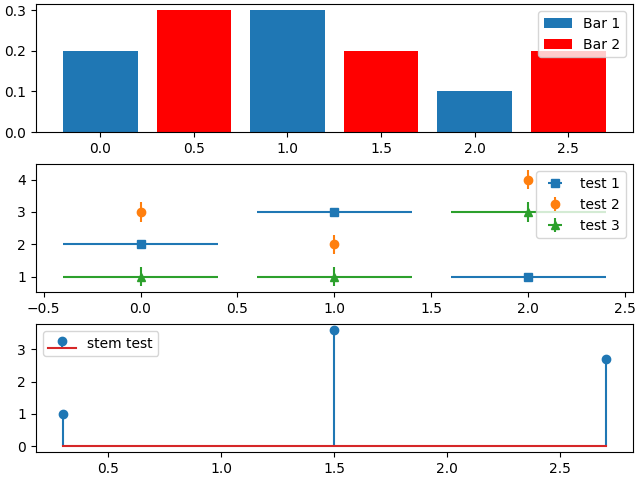
在这里,我们将图例附加到更复杂的图上。
fig, axes = plt.subplots(3, 1, constrained_layout=True)top_ax, middle_ax, bottom_ax = axestop_ax.bar([0, 1, 2], [0.2, 0.3, 0.1], width=0.4, label="Bar 1",align="center")top_ax.bar([0.5, 1.5, 2.5], [0.3, 0.2, 0.2], color="red", width=0.4,label="Bar 2", align="center")top_ax.legend()middle_ax.errorbar([0, 1, 2], [2, 3, 1], xerr=0.4, fmt="s", label="test 1")middle_ax.errorbar([0, 1, 2], [3, 2, 4], yerr=0.3, fmt="o", label="test 2")middle_ax.errorbar([0, 1, 2], [1, 1, 3], xerr=0.4, yerr=0.3, fmt="^",label="test 3")middle_ax.legend()bottom_ax.stem([0.3, 1.5, 2.7], [1, 3.6, 2.7], label="stem test")bottom_ax.legend()plt.show()
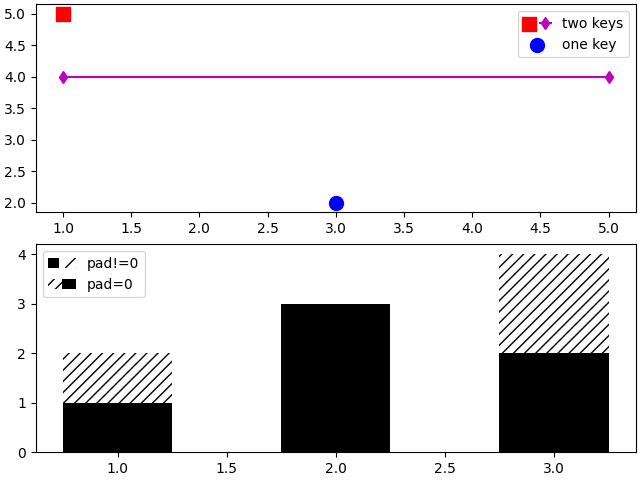
现在我们将展示带有多个关键图例的图例条目。
fig, (ax1, ax2) = plt.subplots(2, 1, constrained_layout=True)# First plot: two legend keys for a single entryp1 = ax1.scatter([1], [5], c='r', marker='s', s=100)p2 = ax1.scatter([3], [2], c='b', marker='o', s=100)# `plot` returns a list, but we want the handle - thus the comma on the leftp3, = ax1.plot([1, 5], [4, 4], 'm-d')# Assign two of the handles to the same legend entry by putting them in a tuple# and using a generic handler map (which would be used for any additional# tuples of handles like (p1, p3)).l = ax1.legend([(p1, p3), p2], ['two keys', 'one key'], scatterpoints=1,numpoints=1, handler_map={tuple: HandlerTuple(ndivide=None)})# Second plot: plot two bar charts on top of each other and change the padding# between the legend keysx_left = [1, 2, 3]y_pos = [1, 3, 2]y_neg = [2, 1, 4]rneg = ax2.bar(x_left, y_neg, width=0.5, color='w', hatch='///', label='-1')rpos = ax2.bar(x_left, y_pos, width=0.5, color='k', label='+1')# Treat each legend entry differently by using specific `HandlerTuple`sl = ax2.legend([(rpos, rneg), (rneg, rpos)], ['pad!=0', 'pad=0'],handler_map={(rpos, rneg): HandlerTuple(ndivide=None),(rneg, rpos): HandlerTuple(ndivide=None, pad=0.)})plt.show()
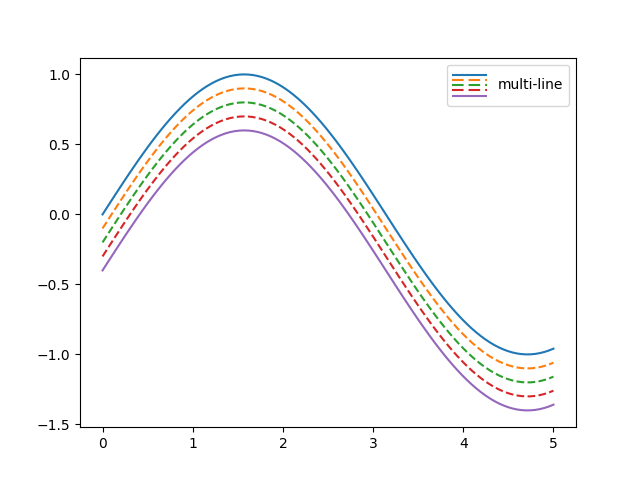
最后,还可以编写定义如何对图例进行样式化的自定义对象。
class HandlerDashedLines(HandlerLineCollection):"""Custom Handler for LineCollection instances."""def create_artists(self, legend, orig_handle,xdescent, ydescent, width, height, fontsize, trans):# figure out how many lines there arenumlines = len(orig_handle.get_segments())xdata, xdata_marker = self.get_xdata(legend, xdescent, ydescent,width, height, fontsize)leglines = []# divide the vertical space where the lines will go# into equal parts based on the number of linesydata = ((height) / (numlines + 1)) * np.ones(xdata.shape, float)# for each line, create the line at the proper location# and set the dash patternfor i in range(numlines):legline = Line2D(xdata, ydata * (numlines - i) - ydescent)self.update_prop(legline, orig_handle, legend)# set color, dash pattern, and linewidth to that# of the lines in linecollectiontry:color = orig_handle.get_colors()[i]except IndexError:color = orig_handle.get_colors()[0]try:dashes = orig_handle.get_dashes()[i]except IndexError:dashes = orig_handle.get_dashes()[0]try:lw = orig_handle.get_linewidths()[i]except IndexError:lw = orig_handle.get_linewidths()[0]if dashes[0] is not None:legline.set_dashes(dashes[1])legline.set_color(color)legline.set_transform(trans)legline.set_linewidth(lw)leglines.append(legline)return leglinesx = np.linspace(0, 5, 100)fig, ax = plt.subplots()colors = plt.rcParams['axes.prop_cycle'].by_key()['color'][:5]styles = ['solid', 'dashed', 'dashed', 'dashed', 'solid']lines = []for i, color, style in zip(range(5), colors, styles):ax.plot(x, np.sin(x) - .1 * i, c=color, ls=style)# make proxy artists# make list of one line -- doesn't matter what the coordinates areline = [[(0, 0)]]# set up the proxy artistlc = mcol.LineCollection(5 * line, linestyles=styles, colors=colors)# create the legendax.legend([lc], ['multi-line'], handler_map={type(lc): HandlerDashedLines()},handlelength=2.5, handleheight=3)plt.show()
下载这个示例

若有收获,就点个赞吧
0 人点赞
