图中插入注释框
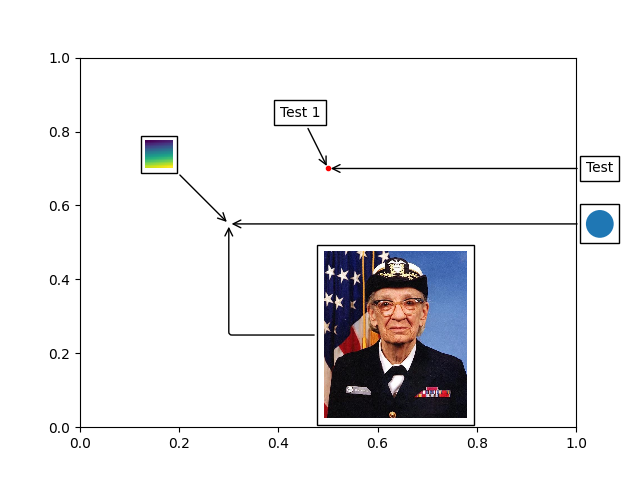
import matplotlib.pyplot as pltimport numpy as npfrom matplotlib.patches import Circlefrom matplotlib.offsetbox import (TextArea, DrawingArea, OffsetImage,AnnotationBbox)from matplotlib.cbook import get_sample_dataif 1:fig, ax = plt.subplots()# Define a 1st position to annotate (display it with a marker)xy = (0.5, 0.7)ax.plot(xy[0], xy[1], ".r")# Annotate the 1st position with a text box ('Test 1')offsetbox = TextArea("Test 1", minimumdescent=False)ab = AnnotationBbox(offsetbox, xy,xybox=(-20, 40),xycoords='data',boxcoords="offset points",arrowprops=dict(arrowstyle="->"))ax.add_artist(ab)# Annotate the 1st position with another text box ('Test')offsetbox = TextArea("Test", minimumdescent=False)ab = AnnotationBbox(offsetbox, xy,xybox=(1.02, xy[1]),xycoords='data',boxcoords=("axes fraction", "data"),box_alignment=(0., 0.5),arrowprops=dict(arrowstyle="->"))ax.add_artist(ab)# Define a 2nd position to annotate (don't display with a marker this time)xy = [0.3, 0.55]# Annotate the 2nd position with a circle patchda = DrawingArea(20, 20, 0, 0)p = Circle((10, 10), 10)da.add_artist(p)ab = AnnotationBbox(da, xy,xybox=(1.02, xy[1]),xycoords='data',boxcoords=("axes fraction", "data"),box_alignment=(0., 0.5),arrowprops=dict(arrowstyle="->"))ax.add_artist(ab)# Annotate the 2nd position with an image (a generated array of pixels)arr = np.arange(100).reshape((10, 10))im = OffsetImage(arr, zoom=2)im.image.axes = axab = AnnotationBbox(im, xy,xybox=(-50., 50.),xycoords='data',boxcoords="offset points",pad=0.3,arrowprops=dict(arrowstyle="->"))ax.add_artist(ab)# Annotate the 2nd position with another image (a Grace Hopper portrait)fn = get_sample_data("grace_hopper.png", asfileobj=False)arr_img = plt.imread(fn, format='png')imagebox = OffsetImage(arr_img, zoom=0.2)imagebox.image.axes = axab = AnnotationBbox(imagebox, xy,xybox=(120., -80.),xycoords='data',boxcoords="offset points",pad=0.5,arrowprops=dict(arrowstyle="->",connectionstyle="angle,angleA=0,angleB=90,rad=3"))ax.add_artist(ab)# Fix the display limits to see everythingax.set_xlim(0, 1)ax.set_ylim(0, 1)plt.show()
下载这个示例

若有收获,就点个赞吧
0 人点赞
