Gridspec演示03
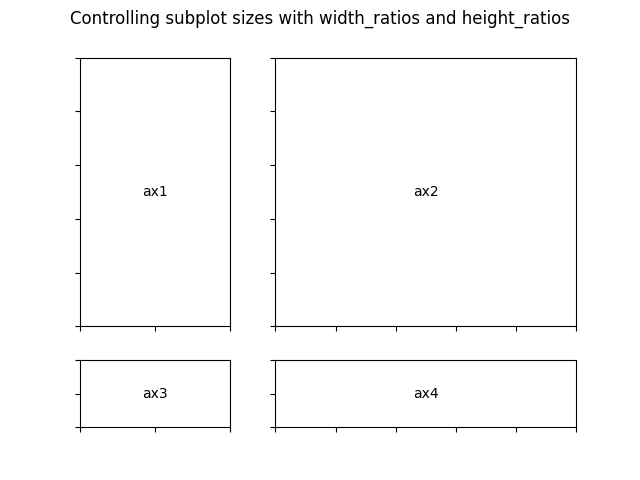
import matplotlib.pyplot as pltfrom matplotlib.gridspec import GridSpecdef make_ticklabels_invisible(fig):for i, ax in enumerate(fig.axes):ax.text(0.5, 0.5, "ax%d" % (i+1), va="center", ha="center")ax.tick_params(labelbottom=False, labelleft=False)# demo 3 : gridspec with subplotpars set.fig = plt.figure()fig.suptitle("GridSpec w/ different subplotpars")gs1 = GridSpec(3, 3)gs1.update(left=0.05, right=0.48, wspace=0.05)ax1 = plt.subplot(gs1[:-1, :])ax2 = plt.subplot(gs1[-1, :-1])ax3 = plt.subplot(gs1[-1, -1])gs2 = GridSpec(3, 3)gs2.update(left=0.55, right=0.98, hspace=0.05)ax4 = plt.subplot(gs2[:, :-1])ax5 = plt.subplot(gs2[:-1, -1])ax6 = plt.subplot(gs2[-1, -1])make_ticklabels_invisible(fig)plt.show()
下载这个示例

若有收获,就点个赞吧
0 人点赞
