用cycler定型
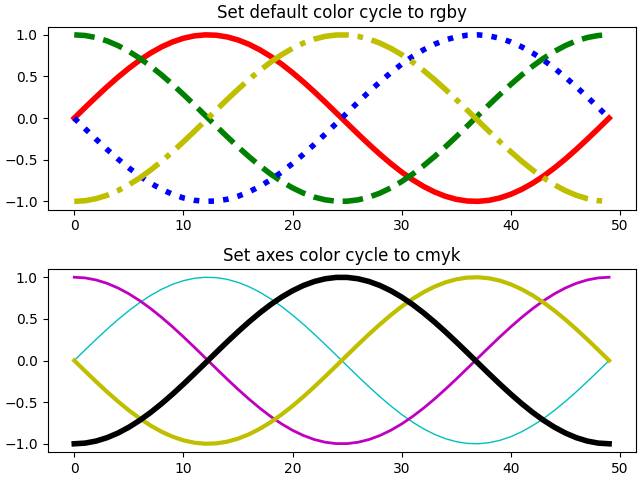
演示自定义特性-循环设置以控制多行绘制的颜色和其他样式特性。
此示例演示了两种不同的API:
from cycler import cyclerimport numpy as npimport matplotlib.pyplot as pltx = np.linspace(0, 2 * np.pi)offsets = np.linspace(0, 2*np.pi, 4, endpoint=False)# Create array with shifted-sine curve along each columnyy = np.transpose([np.sin(x + phi) for phi in offsets])# 1. Setting prop cycle on default rc parameterplt.rc('lines', linewidth=4)plt.rc('axes', prop_cycle=(cycler(color=['r', 'g', 'b', 'y']) +cycler(linestyle=['-', '--', ':', '-.'])))fig, (ax0, ax1) = plt.subplots(nrows=2, constrained_layout=True)ax0.plot(yy)ax0.set_title('Set default color cycle to rgby')# 2. Define prop cycle for single set of axes# For the most general use-case, you can provide a cycler to# `.set_prop_cycle`.# Here, we use the convenient shortcut that we can alternatively pass# one or more properties as keyword arguements. This creates and sets# a cycler iterating simultaneously over all properties.ax1.set_prop_cycle(color=['c', 'm', 'y', 'k'], lw=[1, 2, 3, 4])ax1.plot(yy)ax1.set_title('Set axes color cycle to cmyk')plt.show()
参考
此示例中显示了以下函数,方法,类和模块的使用:
import matplotlibmatplotlib.axes.Axes.plotmatplotlib.axes.Axes.set_prop_cycle
下载这个示例

若有收获,就点个赞吧
0 人点赞
