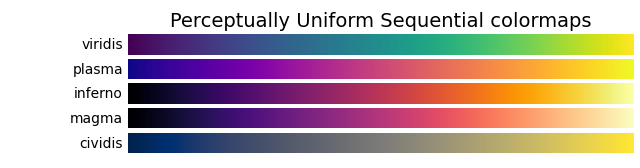
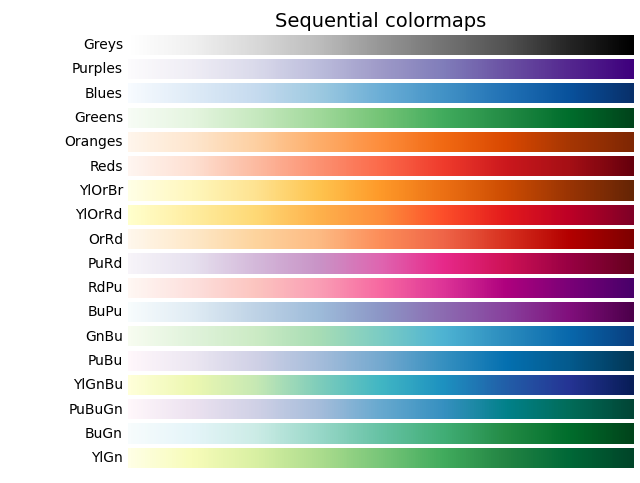
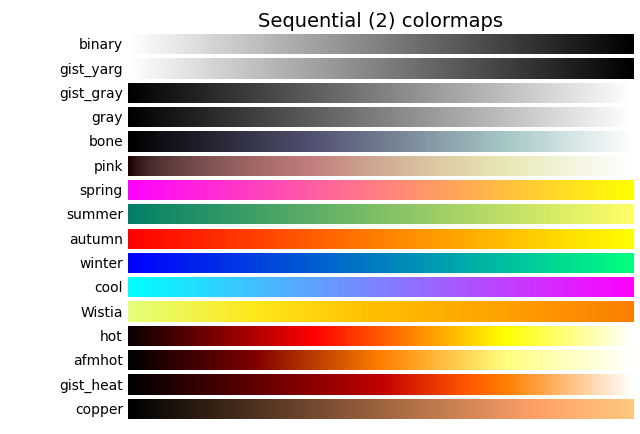
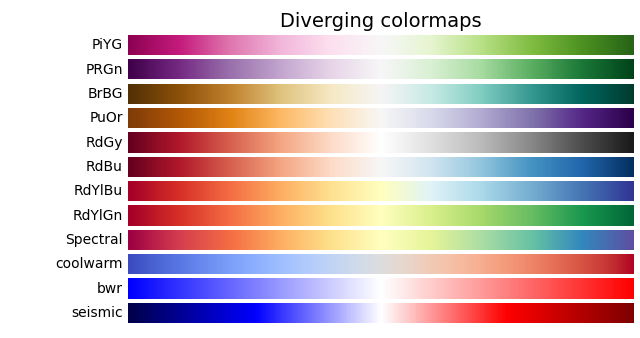
Colormap参考
Matplotlib附带的色彩映射参考。
通过将 _r 附加到名称(例如,viridis_r),可以获得每个这些颜色映射的反转版本。
请参阅在Matplotlib中选择Colormaps以深入讨论色彩映射,包括colorblind-friendlyliness。
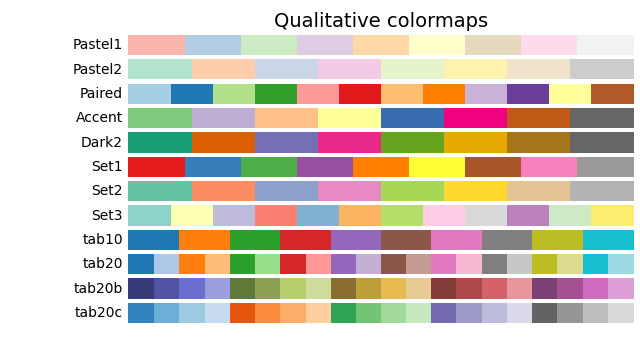
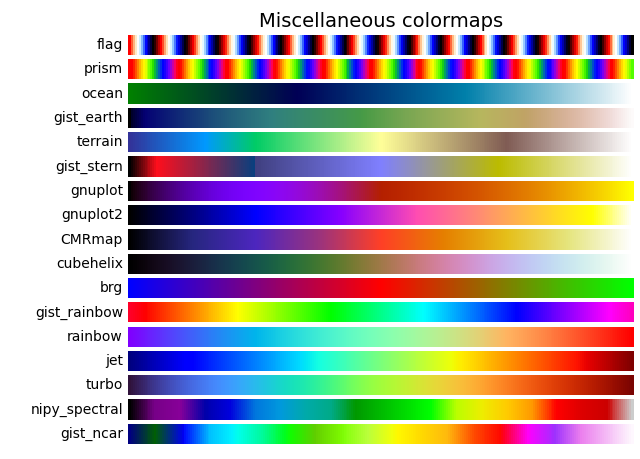
import numpy as npimport matplotlib.pyplot as pltcmaps = [('Perceptually Uniform Sequential', ['viridis', 'plasma', 'inferno', 'magma', 'cividis']),('Sequential', ['Greys', 'Purples', 'Blues', 'Greens', 'Oranges', 'Reds','YlOrBr', 'YlOrRd', 'OrRd', 'PuRd', 'RdPu', 'BuPu','GnBu', 'PuBu', 'YlGnBu', 'PuBuGn', 'BuGn', 'YlGn']),('Sequential (2)', ['binary', 'gist_yarg', 'gist_gray', 'gray', 'bone', 'pink','spring', 'summer', 'autumn', 'winter', 'cool', 'Wistia','hot', 'afmhot', 'gist_heat', 'copper']),('Diverging', ['PiYG', 'PRGn', 'BrBG', 'PuOr', 'RdGy', 'RdBu','RdYlBu', 'RdYlGn', 'Spectral', 'coolwarm', 'bwr', 'seismic']),('Cyclic', ['twilight', 'twilight_shifted', 'hsv']),('Qualitative', ['Pastel1', 'Pastel2', 'Paired', 'Accent','Dark2', 'Set1', 'Set2', 'Set3','tab10', 'tab20', 'tab20b', 'tab20c']),('Miscellaneous', ['flag', 'prism', 'ocean', 'gist_earth', 'terrain', 'gist_stern','gnuplot', 'gnuplot2', 'CMRmap', 'cubehelix', 'brg','gist_rainbow', 'rainbow', 'jet', 'nipy_spectral', 'gist_ncar'])]gradient = np.linspace(0, 1, 256)gradient = np.vstack((gradient, gradient))def plot_color_gradients(cmap_category, cmap_list):# Create figure and adjust figure height to number of colormapsnrows = len(cmap_list)figh = 0.35 + 0.15 + (nrows + (nrows-1)*0.1)*0.22fig, axes = plt.subplots(nrows=nrows, figsize=(6.4, figh))fig.subplots_adjust(top=1-.35/figh, bottom=.15/figh, left=0.2, right=0.99)axes[0].set_title(cmap_category + ' colormaps', fontsize=14)for ax, name in zip(axes, cmap_list):ax.imshow(gradient, aspect='auto', cmap=plt.get_cmap(name))ax.text(-.01, .5, name, va='center', ha='right', fontsize=10,transform=ax.transAxes)# Turn off *all* ticks & spines, not just the ones with colormaps.for ax in axes:ax.set_axis_off()for cmap_category, cmap_list in cmaps:plot_color_gradients(cmap_category, cmap_list)plt.show()

参考
此示例中显示了以下函数,方法,类和模块的使用:
import matplotlibmatplotlib.colorsmatplotlib.axes.Axes.imshowmatplotlib.figure.Figure.textmatplotlib.axes.Axes.set_axis_off
下载这个示例

若有收获,就点个赞吧
0 人点赞
