颜色条
通过指定可映射对象(此处为imshow返回的 AxesImage )和要将颜色条附加到的轴来使用 colorbar。
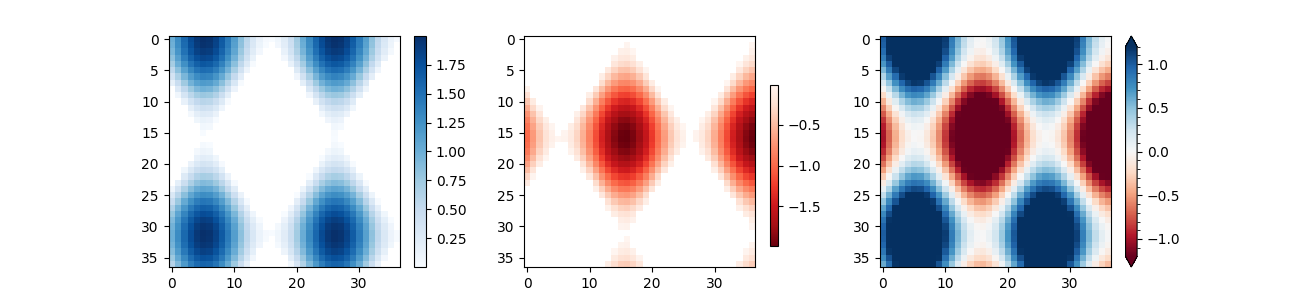
import numpy as npimport matplotlib.pyplot as plt# setup some generic dataN = 37x, y = np.mgrid[:N, :N]Z = (np.cos(x*0.2) + np.sin(y*0.3))# mask out the negative and positive values, respectivelyZpos = np.ma.masked_less(Z, 0)Zneg = np.ma.masked_greater(Z, 0)fig, (ax1, ax2, ax3) = plt.subplots(figsize=(13, 3), ncols=3)# plot just the positive data and save the# color "mappable" object returned by ax1.imshowpos = ax1.imshow(Zpos, cmap='Blues', interpolation='none')# add the colorbar using the figure's method,# telling which mappable we're talking about and# which axes object it should be nearfig.colorbar(pos, ax=ax1)# repeat everything above for the negative dataneg = ax2.imshow(Zneg, cmap='Reds_r', interpolation='none')fig.colorbar(neg, ax=ax2)# Plot both positive and negative values betwen +/- 1.2pos_neg_clipped = ax3.imshow(Z, cmap='RdBu', vmin=-1.2, vmax=1.2,interpolation='none')# Add minorticks on the colorbar to make it easy to read the# values off the colorbar.cbar = fig.colorbar(pos_neg_clipped, ax=ax3, extend='both')cbar.minorticks_on()plt.show()
参考
此示例中显示了以下函数,方法,类和模块的使用:
import matplotlibimport matplotlib.colorbarmatplotlib.axes.Axes.imshowmatplotlib.pyplot.imshowmatplotlib.figure.Figure.colorbarmatplotlib.pyplot.colorbarmatplotlib.colorbar.Colorbar.minorticks_onmatplotlib.colorbar.Colorbar.minorticks_off
下载这个示例

若有收获,就点个赞吧
0 人点赞
