茎状图示
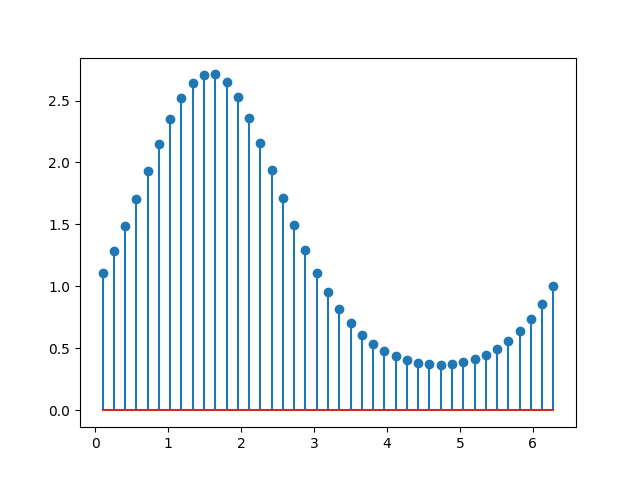
茎图的绘制是从基线到y坐标的垂直线绘制cosine(x) w.r.t x,使用 ‘-.’ 作为绘制垂直线的图案。
import matplotlib.pyplot as pltimport numpy as np# returns 10 evenly spaced samples from 0.1 to 2*PIx = np.linspace(0.1, 2 * np.pi, 10)markerline, stemlines, baseline = plt.stem(x, np.cos(x), '-.')# setting property of baseline with color red and linewidth 2plt.setp(baseline, color='r', linewidth=2)plt.show()
此示例使用了: * matplotlib.axes.Axes.stem()
下载这个示例

若有收获,就点个赞吧
0 人点赞
