QuadMesh 演示
pcolormesh 使用QuadMesh,一种更快的 pcolor 泛化,但有一些限制。
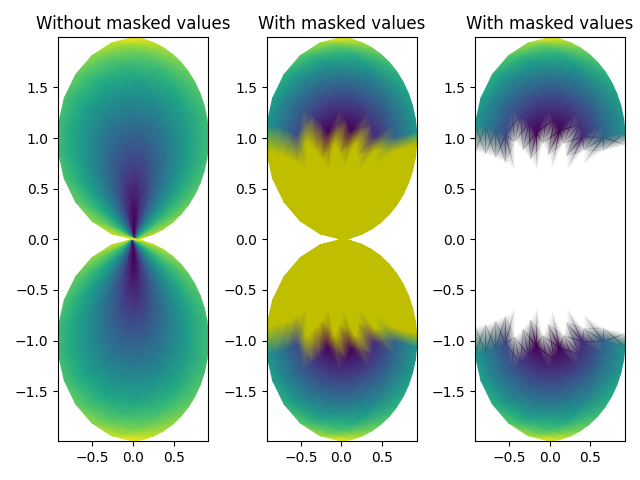
此演示说明了带有掩码数据的quadmesh中的误差。
import copyfrom matplotlib import cm, pyplot as pltimport numpy as npn = 12x = np.linspace(-1.5, 1.5, n)y = np.linspace(-1.5, 1.5, n * 2)X, Y = np.meshgrid(x, y)Qx = np.cos(Y) - np.cos(X)Qz = np.sin(Y) + np.sin(X)Z = np.sqrt(X**2 + Y**2) / 5Z = (Z - Z.min()) / (Z.max() - Z.min())# The color array can include masked values.Zm = np.ma.masked_where(np.abs(Qz) < 0.5 * np.max(Qz), Z)fig, axs = plt.subplots(nrows=1, ncols=3)axs[0].pcolormesh(Qx, Qz, Z, shading='gouraud')axs[0].set_title('Without masked values')# You can control the color of the masked region. We copy the default colormap# before modifying it.cmap = copy.copy(cm.get_cmap(plt.rcParams['image.cmap']))cmap.set_bad('y', 1.0)axs[1].pcolormesh(Qx, Qz, Zm, shading='gouraud', cmap=cmap)axs[1].set_title('With masked values')# Or use the default, which is transparent.axs[2].pcolormesh(Qx, Qz, Zm, shading='gouraud')axs[2].set_title('With masked values')fig.tight_layout()plt.show()
参考
下面的示例演示了以下函数和方法的使用:
import matplotlibmatplotlib.axes.Axes.pcolormeshmatplotlib.pyplot.pcolormesh
下载这个示例

若有收获,就点个赞吧
0 人点赞
