自动文本偏移
演示如何使用pathpatch_2d_to_3d在3D绘图上“绘制”形状和文本。
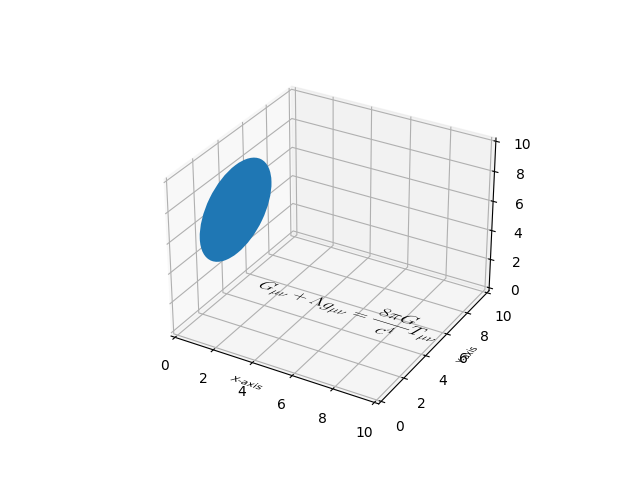
import numpy as npimport matplotlib.pyplot as pltfrom matplotlib.patches import Circle, PathPatchfrom matplotlib.text import TextPathfrom matplotlib.transforms import Affine2D# This import registers the 3D projection, but is otherwise unused.from mpl_toolkits.mplot3d import Axes3D # noqa: F401 unused importimport mpl_toolkits.mplot3d.art3d as art3ddef text3d(ax, xyz, s, zdir="z", size=None, angle=0, usetex=False, **kwargs):'''Plots the string 's' on the axes 'ax', with position 'xyz', size 'size',and rotation angle 'angle'. 'zdir' gives the axis which is to be treatedas the third dimension. usetex is a boolean indicating whether the stringshould be interpreted as latex or not. Any additional keyword argumentsare passed on to transform_path.Note: zdir affects the interpretation of xyz.'''x, y, z = xyzif zdir == "y":xy1, z1 = (x, z), yelif zdir == "x":xy1, z1 = (y, z), xelse:xy1, z1 = (x, y), ztext_path = TextPath((0, 0), s, size=size, usetex=usetex)trans = Affine2D().rotate(angle).translate(xy1[0], xy1[1])p1 = PathPatch(trans.transform_path(text_path), **kwargs)ax.add_patch(p1)art3d.pathpatch_2d_to_3d(p1, z=z1, zdir=zdir)fig = plt.figure()ax = fig.add_subplot(111, projection='3d')# Draw a circle on the x=0 'wall'p = Circle((5, 5), 3)ax.add_patch(p)art3d.pathpatch_2d_to_3d(p, z=0, zdir="x")# Manually label the axestext3d(ax, (4, -2, 0), "X-axis", zdir="z", size=.5, usetex=False,ec="none", fc="k")text3d(ax, (12, 4, 0), "Y-axis", zdir="z", size=.5, usetex=False,angle=np.pi / 2, ec="none", fc="k")text3d(ax, (12, 10, 4), "Z-axis", zdir="y", size=.5, usetex=False,angle=np.pi / 2, ec="none", fc="k")# Write a Latex formula on the z=0 'floor'text3d(ax, (1, 5, 0),r"$\displaystyle G_{\mu\nu} + \Lambda g_{\mu\nu} = "r"\frac{8\pi G}{c^4} T_{\mu\nu} $",zdir="z", size=1, usetex=True,ec="none", fc="k")ax.set_xlim(0, 10)ax.set_ylim(0, 10)ax.set_zlim(0, 10)plt.show()
下载这个示例

若有收获,就点个赞吧
0 人点赞
