对数演示
具有对数轴的图的示例。
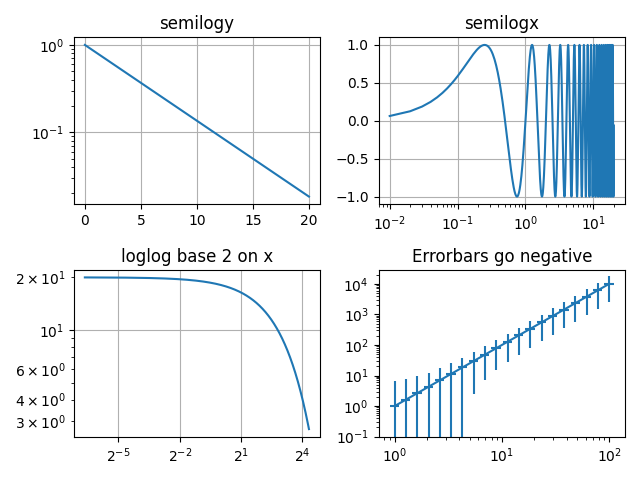
import numpy as npimport matplotlib.pyplot as plt# Data for plottingt = np.arange(0.01, 20.0, 0.01)# Create figurefig, ((ax1, ax2), (ax3, ax4)) = plt.subplots(2, 2)# log y axisax1.semilogy(t, np.exp(-t / 5.0))ax1.set(title='semilogy')ax1.grid()# log x axisax2.semilogx(t, np.sin(2 * np.pi * t))ax2.set(title='semilogx')ax2.grid()# log x and y axisax3.loglog(t, 20 * np.exp(-t / 10.0), basex=2)ax3.set(title='loglog base 2 on x')ax3.grid()# With errorbars: clip non-positive values# Use new data for plottingx = 10.0**np.linspace(0.0, 2.0, 20)y = x**2.0ax4.set_xscale("log", nonposx='clip')ax4.set_yscale("log", nonposy='clip')ax4.set(title='Errorbars go negative')ax4.errorbar(x, y, xerr=0.1 * x, yerr=5.0 + 0.75 * y)# ylim must be set after errorbar to allow errorbar to autoscale limitsax4.set_ylim(bottom=0.1)fig.tight_layout()plt.show()
下载这个示例

若有收获,就点个赞吧
0 人点赞
