轴方向演示步骤02
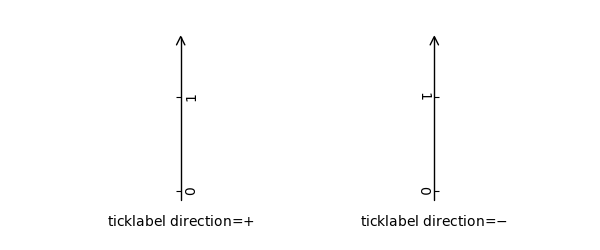
import matplotlib.pyplot as pltimport mpl_toolkits.axisartist as axisartistdef setup_axes(fig, rect):ax = axisartist.Subplot(fig, rect)fig.add_axes(ax)ax.set_ylim(-0.1, 1.5)ax.set_yticks([0, 1])#ax.axis[:].toggle(all=False)#ax.axis[:].line.set_visible(False)ax.axis[:].set_visible(False)ax.axis["x"] = ax.new_floating_axis(1, 0.5)ax.axis["x"].set_axisline_style("->", size=1.5)return axfig = plt.figure(figsize=(6, 2.5))fig.subplots_adjust(bottom=0.2, top=0.8)ax1 = setup_axes(fig, "121")ax1.axis["x"].set_ticklabel_direction("+")ax1.annotate("ticklabel direction=$+$", (0.5, 0), xycoords="axes fraction",xytext=(0, -10), textcoords="offset points",va="top", ha="center")ax2 = setup_axes(fig, "122")ax2.axis["x"].set_ticklabel_direction("-")ax2.annotate("ticklabel direction=$-$", (0.5, 0), xycoords="axes fraction",xytext=(0, -10), textcoords="offset points",va="top", ha="center")plt.show()
下载这个示例

若有收获,就点个赞吧
0 人点赞
