颜色映射规格化
演示使用规范以非线性方式将颜色映射映射到数据上。
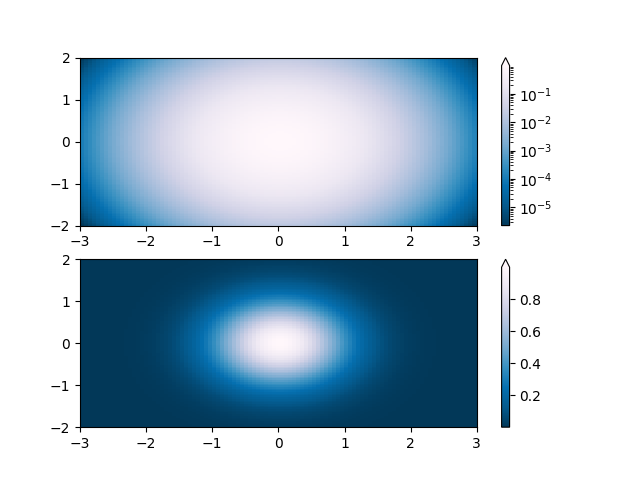
import numpy as npimport matplotlib.pyplot as pltimport matplotlib.colors as colors'''Lognorm: Instead of pcolor log10(Z1) you can have colorbars that havethe exponential labels using a norm.'''N = 100X, Y = np.mgrid[-3:3:complex(0, N), -2:2:complex(0, N)]# A low hump with a spike coming out of the top right. Needs to have# z/colour axis on a log scale so we see both hump and spike. linear# scale only shows the spike.Z = np.exp(-X**2 - Y**2)fig, ax = plt.subplots(2, 1)pcm = ax[0].pcolor(X, Y, Z,norm=colors.LogNorm(vmin=Z.min(), vmax=Z.max()),cmap='PuBu_r')fig.colorbar(pcm, ax=ax[0], extend='max')pcm = ax[1].pcolor(X, Y, Z, cmap='PuBu_r')fig.colorbar(pcm, ax=ax[1], extend='max')plt.show()
下载这个示例

若有收获,就点个赞吧
0 人点赞
