自定义比例尺
通过在墨卡托投影中实现纬度数据的缩放用途来创建自定义比例。
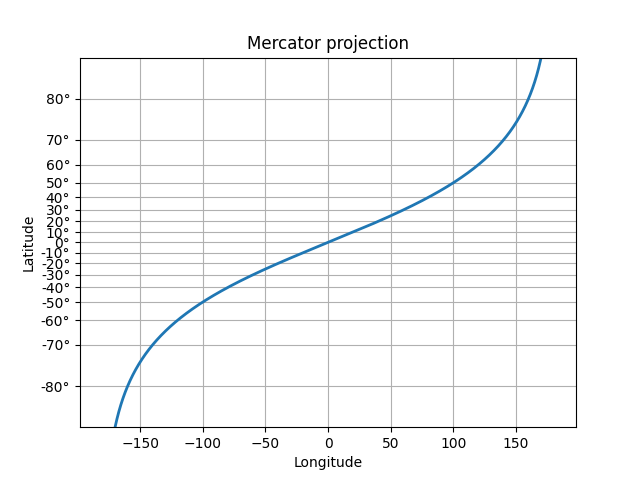
import numpy as npfrom numpy import mafrom matplotlib import scale as mscalefrom matplotlib import transforms as mtransformsfrom matplotlib.ticker import Formatter, FixedLocatorfrom matplotlib import rcParams# BUG: this example fails with any other setting of axisbelowrcParams['axes.axisbelow'] = Falseclass MercatorLatitudeScale(mscale.ScaleBase):"""Scales data in range -pi/2 to pi/2 (-90 to 90 degrees) usingthe system used to scale latitudes in a Mercator projection.The scale function:ln(tan(y) + sec(y))The inverse scale function:atan(sinh(y))Since the Mercator scale tends to infinity at +/- 90 degrees,there is user-defined threshold, above and below which nothingwill be plotted. This defaults to +/- 85 degrees.source:http://en.wikipedia.org/wiki/Mercator_projection"""# The scale class must have a member ``name`` that defines the# string used to select the scale. For example,# ``gca().set_yscale("mercator")`` would be used to select this# scale.name = 'mercator'def __init__(self, axis, *, thresh=np.deg2rad(85), **kwargs):"""Any keyword arguments passed to ``set_xscale`` and``set_yscale`` will be passed along to the scale'sconstructor.thresh: The degree above which to crop the data."""mscale.ScaleBase.__init__(self)if thresh >= np.pi / 2:raise ValueError("thresh must be less than pi/2")self.thresh = threshdef get_transform(self):"""Override this method to return a new instance that does theactual transformation of the data.The MercatorLatitudeTransform class is defined below as anested class of this one."""return self.MercatorLatitudeTransform(self.thresh)def set_default_locators_and_formatters(self, axis):"""Override to set up the locators and formatters to use with thescale. This is only required if the scale requires customlocators and formatters. Writing custom locators andformatters is rather outside the scope of this example, butthere are many helpful examples in ``ticker.py``.In our case, the Mercator example uses a fixed locator from-90 to 90 degrees and a custom formatter class to put convertthe radians to degrees and put a degree symbol after thevalue::"""class DegreeFormatter(Formatter):def __call__(self, x, pos=None):return "%d\N{DEGREE SIGN}" % np.degrees(x)axis.set_major_locator(FixedLocator(np.radians(np.arange(-90, 90, 10))))axis.set_major_formatter(DegreeFormatter())axis.set_minor_formatter(DegreeFormatter())def limit_range_for_scale(self, vmin, vmax, minpos):"""Override to limit the bounds of the axis to the domain of thetransform. In the case of Mercator, the bounds should belimited to the threshold that was passed in. Unlike theautoscaling provided by the tick locators, this range limitingwill always be adhered to, whether the axis range is setmanually, determined automatically or changed through panningand zooming."""return max(vmin, -self.thresh), min(vmax, self.thresh)class MercatorLatitudeTransform(mtransforms.Transform):# There are two value members that must be defined.# ``input_dims`` and ``output_dims`` specify number of input# dimensions and output dimensions to the transformation.# These are used by the transformation framework to do some# error checking and prevent incompatible transformations from# being connected together. When defining transforms for a# scale, which are, by definition, separable and have only one# dimension, these members should always be set to 1.input_dims = 1output_dims = 1is_separable = Truehas_inverse = Truedef __init__(self, thresh):mtransforms.Transform.__init__(self)self.thresh = threshdef transform_non_affine(self, a):"""This transform takes an Nx1 ``numpy`` array and returns atransformed copy. Since the range of the Mercator scaleis limited by the user-specified threshold, the inputarray must be masked to contain only valid values.``matplotlib`` will handle masked arrays and remove theout-of-range data from the plot. Importantly, the``transform`` method *must* return an array that is thesame shape as the input array, since these values need toremain synchronized with values in the other dimension."""masked = ma.masked_where((a < -self.thresh) | (a > self.thresh), a)if masked.mask.any():return ma.log(np.abs(ma.tan(masked) + 1.0 / ma.cos(masked)))else:return np.log(np.abs(np.tan(a) + 1.0 / np.cos(a)))def inverted(self):"""Override this method so matplotlib knows how to get theinverse transform for this transform."""return MercatorLatitudeScale.InvertedMercatorLatitudeTransform(self.thresh)class InvertedMercatorLatitudeTransform(mtransforms.Transform):input_dims = 1output_dims = 1is_separable = Truehas_inverse = Truedef __init__(self, thresh):mtransforms.Transform.__init__(self)self.thresh = threshdef transform_non_affine(self, a):return np.arctan(np.sinh(a))def inverted(self):return MercatorLatitudeScale.MercatorLatitudeTransform(self.thresh)# Now that the Scale class has been defined, it must be registered so# that ``matplotlib`` can find it.mscale.register_scale(MercatorLatitudeScale)if __name__ == '__main__':import matplotlib.pyplot as pltt = np.arange(-180.0, 180.0, 0.1)s = np.radians(t)/2.plt.plot(t, s, '-', lw=2)plt.gca().set_yscale('mercator')plt.xlabel('Longitude')plt.ylabel('Latitude')plt.title('Mercator: Projection of the Oppressor')plt.grid(True)plt.show()
下载这个示例

若有收获,就点个赞吧
0 人点赞
