MRI
此示例说明如何将(MRI)图像读入NumPy阵列,并使用imshow以灰度显示。
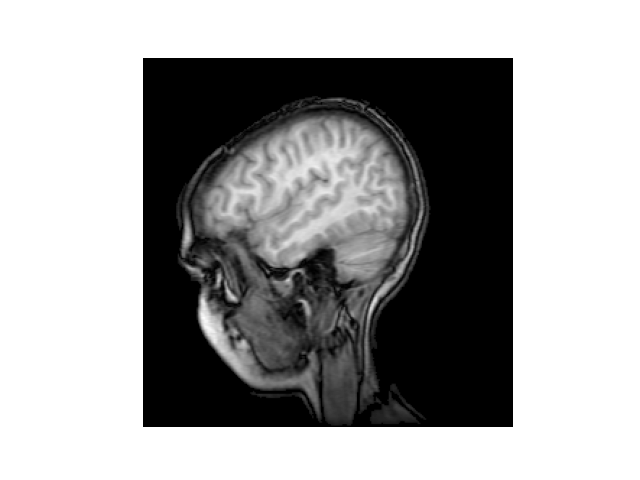
import matplotlib.pyplot as pltimport matplotlib.cbook as cbookimport matplotlib.cm as cmimport numpy as np# Data are 256x256 16 bit integerswith cbook.get_sample_data('s1045.ima.gz') as dfile:im = np.fromstring(dfile.read(), np.uint16).reshape((256, 256))fig, ax = plt.subplots(num="MRI_demo")ax.imshow(im, cmap=cm.gray)ax.axis('off')plt.show()
下载这个示例

若有收获,就点个赞吧
0 人点赞
