0.99版本轴网格新特性
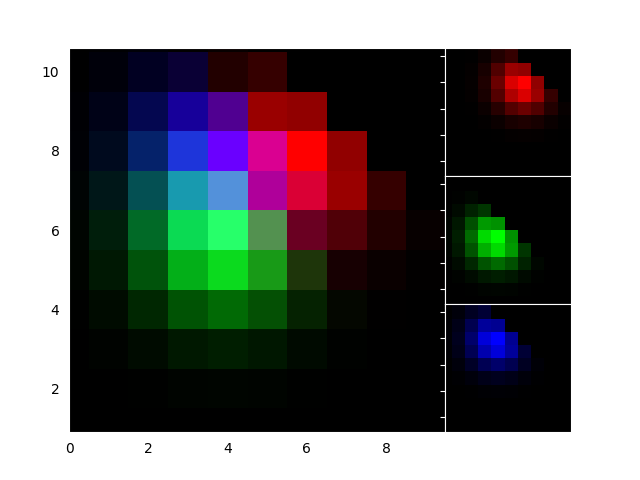
创建RGB合成图像。
import numpy as npimport matplotlib.pyplot as pltfrom mpl_toolkits.axes_grid1.axes_rgb import RGBAxesdef get_demo_image():# prepare imagedelta = 0.5extent = (-3, 4, -4, 3)x = np.arange(-3.0, 4.001, delta)y = np.arange(-4.0, 3.001, delta)X, Y = np.meshgrid(x, y)Z1 = np.exp(-X**2 - Y**2)Z2 = np.exp(-(X - 1)**2 - (Y - 1)**2)Z = (Z1 - Z2) * 2return Z, extentdef get_rgb():Z, extent = get_demo_image()Z[Z < 0] = 0.Z = Z / Z.max()R = Z[:13, :13]G = Z[2:, 2:]B = Z[:13, 2:]return R, G, Bfig = plt.figure(1)ax = RGBAxes(fig, [0.1, 0.1, 0.8, 0.8])r, g, b = get_rgb()kwargs = dict(origin="lower", interpolation="nearest")ax.imshow_rgb(r, g, b, **kwargs)ax.RGB.set_xlim(0., 9.5)ax.RGB.set_ylim(0.9, 10.6)plt.show()
参考
此示例中显示了以下函数,方法,类和模块的使用:
import mpl_toolkitsmpl_toolkits.axes_grid1.axes_rgb.RGBAxesmpl_toolkits.axes_grid1.axes_rgb.RGBAxes.imshow_rgb
下载这个示例

若有收获,就点个赞吧
0 人点赞
