修改坐标格式化程序
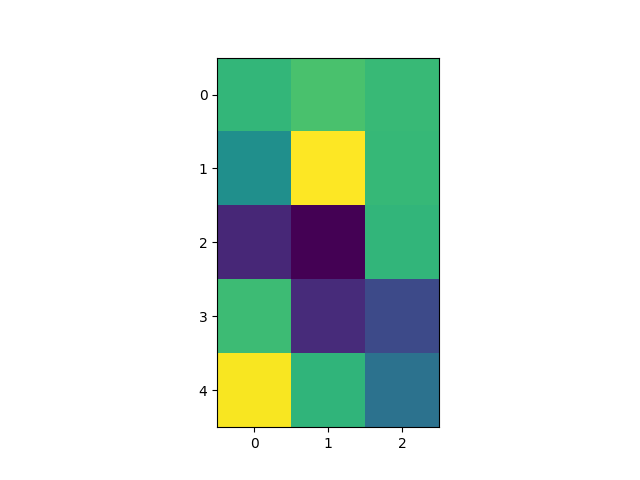
修改坐标格式化程序,以报告给定x和y的最近像素的图像“z”值。这个功能在默认情况下是内置的,但是展示如何自定义Format_coord函数仍然很有用。
import numpy as npimport matplotlib.pyplot as plt# Fixing random state for reproducibilitynp.random.seed(19680801)X = 10*np.random.rand(5, 3)fig, ax = plt.subplots()ax.imshow(X, interpolation='nearest')numrows, numcols = X.shapedef format_coord(x, y):col = int(x + 0.5)row = int(y + 0.5)if col >= 0 and col < numcols and row >= 0 and row < numrows:z = X[row, col]return 'x=%1.4f, y=%1.4f, z=%1.4f' % (x, y, z)else:return 'x=%1.4f, y=%1.4f' % (x, y)ax.format_coord = format_coordplt.show()
参考
本例中显示了下列函数、方法、类和模块的使用:
import matplotlibmatplotlib.axes.Axes.format_coordmatplotlib.axes.Axes.imshow
下载这个示例

若有收获,就点个赞吧
0 人点赞
