与单位组合的条形图
此示例与以厘米为单位的条形图演示相同。
此示例需要 basic_units.py
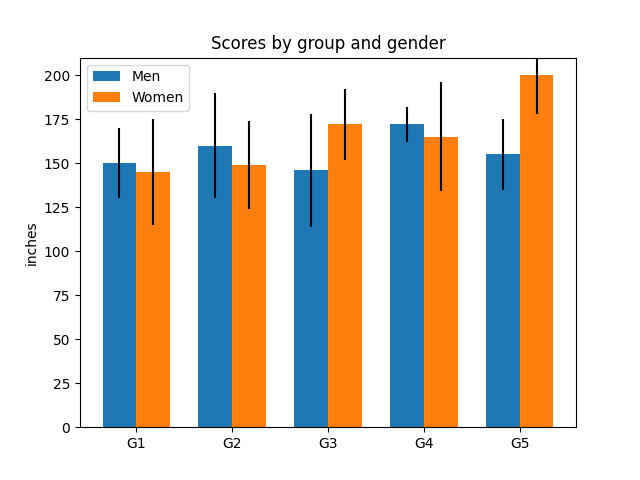
import numpy as npfrom basic_units import cm, inchimport matplotlib.pyplot as pltN = 5menMeans = (150*cm, 160*cm, 146*cm, 172*cm, 155*cm)menStd = (20*cm, 30*cm, 32*cm, 10*cm, 20*cm)fig, ax = plt.subplots()ind = np.arange(N) # the x locations for the groupswidth = 0.35 # the width of the barsp1 = ax.bar(ind, menMeans, width, color='r', bottom=0*cm, yerr=menStd)womenMeans = (145*cm, 149*cm, 172*cm, 165*cm, 200*cm)womenStd = (30*cm, 25*cm, 20*cm, 31*cm, 22*cm)p2 = ax.bar(ind + width, womenMeans, width,color='y', bottom=0*cm, yerr=womenStd)ax.set_title('Scores by group and gender')ax.set_xticks(ind + width / 2)ax.set_xticklabels(('G1', 'G2', 'G3', 'G4', 'G5'))ax.legend((p1[0], p2[0]), ('Men', 'Women'))ax.yaxis.set_units(inch)ax.autoscale_view()plt.show()
下载这个示例

若有收获,就点个赞吧
0 人点赞
