简单图例
创建一个简单的图。
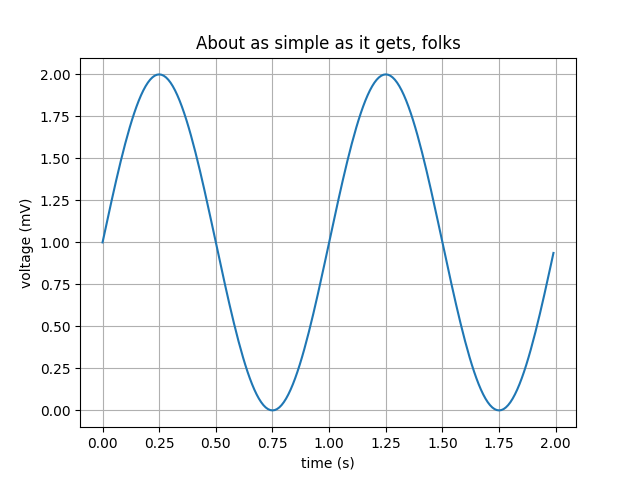
import matplotlibimport matplotlib.pyplot as pltimport numpy as np# Data for plottingt = np.arange(0.0, 2.0, 0.01)s = 1 + np.sin(2 * np.pi * t)fig, ax = plt.subplots()ax.plot(t, s)ax.set(xlabel='time (s)', ylabel='voltage (mV)',title='About as simple as it gets, folks')ax.grid()fig.savefig("test.png")plt.show()
参考
下面的示例演示了以下函数和方法的使用:
matplotlib.axes.Axes.plotmatplotlib.pyplot.plotmatplotlib.pyplot.subplotsmatplotlib.figure.Figure.savefig
下载这个示例

若有收获,就点个赞吧
0 人点赞
