Viewlims
创建两个相同的面板。在右侧面板上放大将在第一个面板中显示一个矩形,表示缩放的区域。
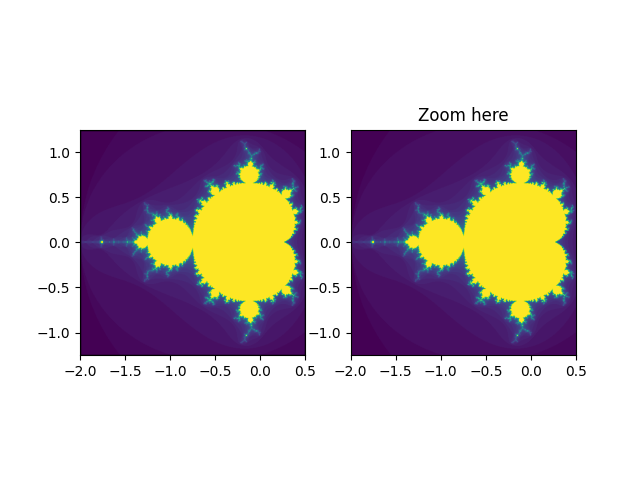
import numpy as npimport matplotlib.pyplot as pltfrom matplotlib.patches import Rectangle# We just subclass Rectangle so that it can be called with an Axes# instance, causing the rectangle to update its shape to match the# bounds of the Axesclass UpdatingRect(Rectangle):def __call__(self, ax):self.set_bounds(*ax.viewLim.bounds)ax.figure.canvas.draw_idle()# A class that will regenerate a fractal set as we zoom in, so that you# can actually see the increasing detail. A box in the left panel will show# the area to which we are zoomed.class MandelbrotDisplay(object):def __init__(self, h=500, w=500, niter=50, radius=2., power=2):self.height = hself.width = wself.niter = niterself.radius = radiusself.power = powerdef __call__(self, xstart, xend, ystart, yend):self.x = np.linspace(xstart, xend, self.width)self.y = np.linspace(ystart, yend, self.height).reshape(-1, 1)c = self.x + 1.0j * self.ythreshold_time = np.zeros((self.height, self.width))z = np.zeros(threshold_time.shape, dtype=complex)mask = np.ones(threshold_time.shape, dtype=bool)for i in range(self.niter):z[mask] = z[mask]**self.power + c[mask]mask = (np.abs(z) < self.radius)threshold_time += maskreturn threshold_timedef ax_update(self, ax):ax.set_autoscale_on(False) # Otherwise, infinite loop# Get the number of points from the number of pixels in the windowdims = ax.patch.get_window_extent().boundsself.width = int(dims[2] + 0.5)self.height = int(dims[2] + 0.5)# Get the range for the new areaxstart, ystart, xdelta, ydelta = ax.viewLim.boundsxend = xstart + xdeltayend = ystart + ydelta# Update the image object with our new data and extentim = ax.images[-1]im.set_data(self.__call__(xstart, xend, ystart, yend))im.set_extent((xstart, xend, ystart, yend))ax.figure.canvas.draw_idle()md = MandelbrotDisplay()Z = md(-2., 0.5, -1.25, 1.25)fig1, (ax1, ax2) = plt.subplots(1, 2)ax1.imshow(Z, origin='lower', extent=(md.x.min(), md.x.max(), md.y.min(), md.y.max()))ax2.imshow(Z, origin='lower', extent=(md.x.min(), md.x.max(), md.y.min(), md.y.max()))rect = UpdatingRect([0, 0], 0, 0, facecolor='None', edgecolor='black', linewidth=1.0)rect.set_bounds(*ax2.viewLim.bounds)ax1.add_patch(rect)# Connect for changing the view limitsax2.callbacks.connect('xlim_changed', rect)ax2.callbacks.connect('ylim_changed', rect)ax2.callbacks.connect('xlim_changed', md.ax_update)ax2.callbacks.connect('ylim_changed', md.ax_update)ax2.set_title("Zoom here")plt.show()
下载这个示例

若有收获,就点个赞吧
0 人点赞
