极坐标下的三维曲面
演示绘制在极坐标中定义的曲面。使用YlGnBu颜色映射的反转版本。还演示了使用乳胶数学模式编写轴标签。
示例由Armin Moser提供。
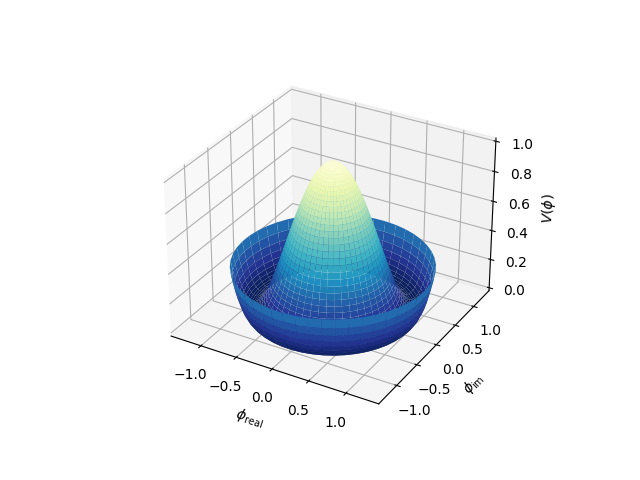
# This import registers the 3D projection, but is otherwise unused.from mpl_toolkits.mplot3d import Axes3D # noqa: F401 unused importimport matplotlib.pyplot as pltimport numpy as npfig = plt.figure()ax = fig.add_subplot(111, projection='3d')# Create the mesh in polar coordinates and compute corresponding Z.r = np.linspace(0, 1.25, 50)p = np.linspace(0, 2*np.pi, 50)R, P = np.meshgrid(r, p)Z = ((R**2 - 1)**2)# Express the mesh in the cartesian system.X, Y = R*np.cos(P), R*np.sin(P)# Plot the surface.ax.plot_surface(X, Y, Z, cmap=plt.cm.YlGnBu_r)# Tweak the limits and add latex math labels.ax.set_zlim(0, 1)ax.set_xlabel(r'$\phi_\mathrm{real}$')ax.set_ylabel(r'$\phi_\mathrm{im}$')ax.set_zlabel(r'$V(\phi)$')plt.show()
下载这个示例

若有收获,就点个赞吧
0 人点赞
