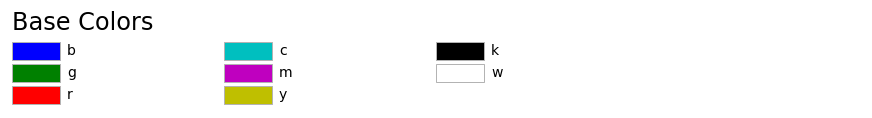
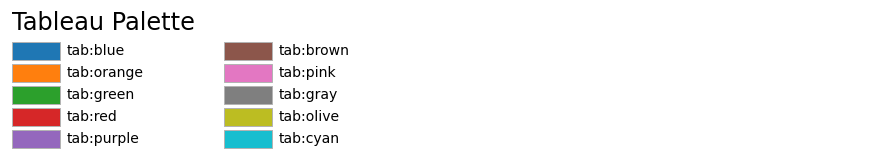
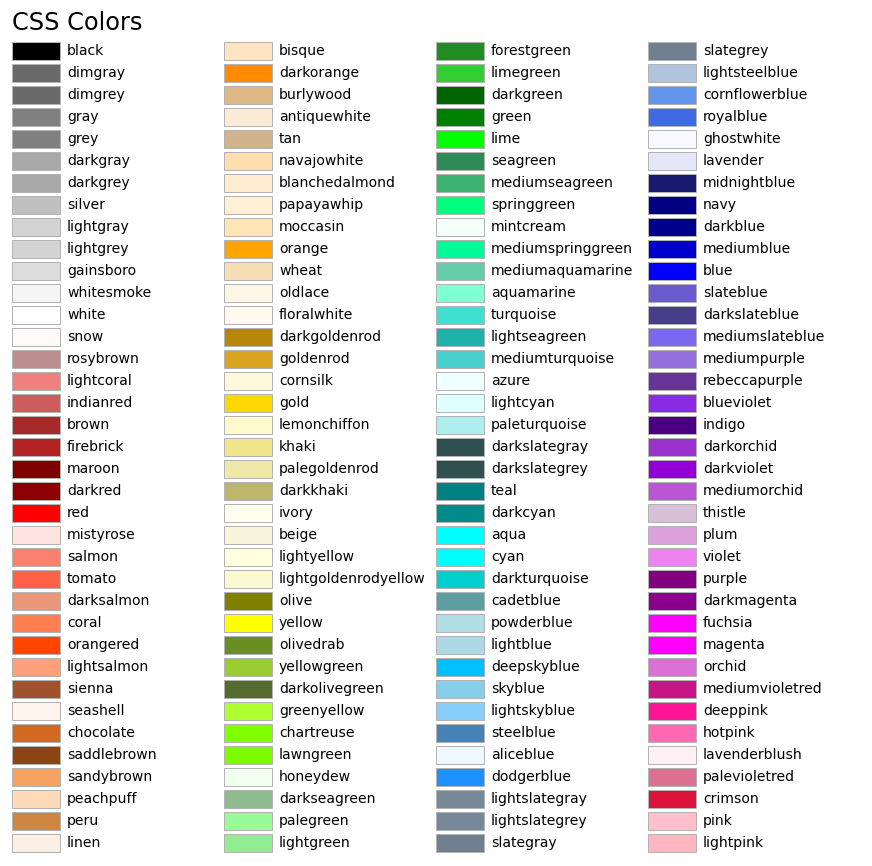
可视化命名颜色
这绘制了matplotlib中支持的命名颜色列表。 请注意,也支持xkcd颜色,但为简洁起见,此处未列出。
有关matplotlib中颜色的更多信息,请参阅:
- 指定颜色教程;
- matplotlib.colors API;
- 颜色演示。
import matplotlib.pyplot as pltimport matplotlib.colors as mcolorsdef plot_colortable(colors, title, sort_colors=True, emptycols=0):cell_width = 212cell_height = 22swatch_width = 48margin = 12topmargin = 40# Sort colors by hue, saturation, value and name.by_hsv = ((tuple(mcolors.rgb_to_hsv(mcolors.to_rgba(color)[:3])), name)for name, color in colors.items())if sort_colors is True:by_hsv = sorted(by_hsv)names = [name for hsv, name in by_hsv]n = len(names)ncols = 4 - emptycolsnrows = n // ncols + int(n % ncols > 0)width = cell_width * 4 + 2 * marginheight = cell_height * nrows + margin + topmargindpi = 72fig, ax = plt.subplots(figsize=(width / dpi, height / dpi), dpi=dpi)fig.subplots_adjust(margin/width, margin/height,(width-margin)/width, (height-topmargin)/height)ax.set_xlim(0, cell_width * 4)ax.set_ylim(cell_height * (nrows-0.5), -cell_height/2.)ax.yaxis.set_visible(False)ax.xaxis.set_visible(False)ax.set_axis_off()ax.set_title(title, fontsize=24, loc="left", pad=10)for i, name in enumerate(names):row = i % nrowscol = i // nrowsy = row * cell_heightswatch_start_x = cell_width * colswatch_end_x = cell_width * col + swatch_widthtext_pos_x = cell_width * col + swatch_width + 7ax.text(text_pos_x, y, name, fontsize=14,horizontalalignment='left',verticalalignment='center')ax.hlines(y, swatch_start_x, swatch_end_x,color=colors[name], linewidth=18)return figplot_colortable(mcolors.BASE_COLORS, "Base Colors",sort_colors=False, emptycols=1)plot_colortable(mcolors.TABLEAU_COLORS, "Tableau Palette",sort_colors=False, emptycols=2)#sphinx_gallery_thumbnail_number = 3plot_colortable(mcolors.CSS4_COLORS, "CSS Colors")# Optionally plot the XKCD colors (Caution: will produce large figure)#xkcd_fig = plot_colortable(mcolors.XKCD_COLORS, "XKCD Colors")#xkcd_fig.savefig("XKCD_Colors.png")plt.show()
参考
此示例中显示了以下函数,方法,类和模块的使用:
import matplotlibmatplotlib.colorsmatplotlib.colors.rgb_to_hsvmatplotlib.colors.to_rgbamatplotlib.figure.Figure.get_size_inchesmatplotlib.figure.Figure.subplots_adjustmatplotlib.axes.Axes.textmatplotlib.axes.Axes.hlines
下载这个示例

若有收获,就点个赞吧
0 人点赞
