Contourf 影线法
演示填充轮廓图形与阴影模式。
import matplotlib.pyplot as pltimport numpy as np# invent some numbers, turning the x and y arrays into simple# 2d arrays, which make combining them together easier.x = np.linspace(-3, 5, 150).reshape(1, -1)y = np.linspace(-3, 5, 120).reshape(-1, 1)z = np.cos(x) + np.sin(y)# we no longer need x and y to be 2 dimensional, so flatten them.x, y = x.flatten(), y.flatten()
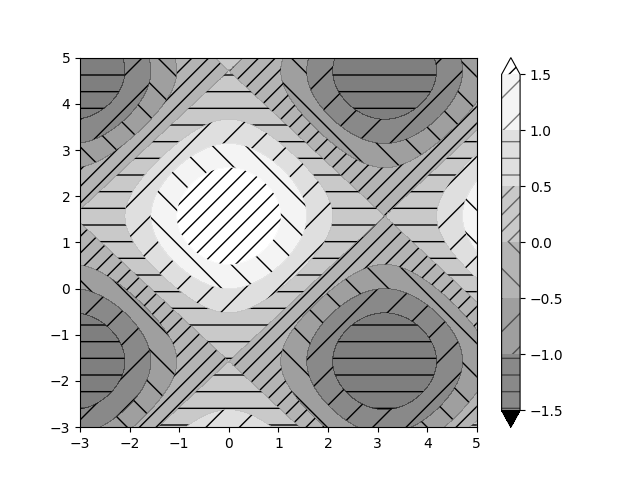
图1:最简单的带彩色条的阴影图
fig1, ax1 = plt.subplots()cs = ax1.contourf(x, y, z, hatches=['-', '/', '\\', '//'],cmap='gray', extend='both', alpha=0.5)fig1.colorbar(cs)
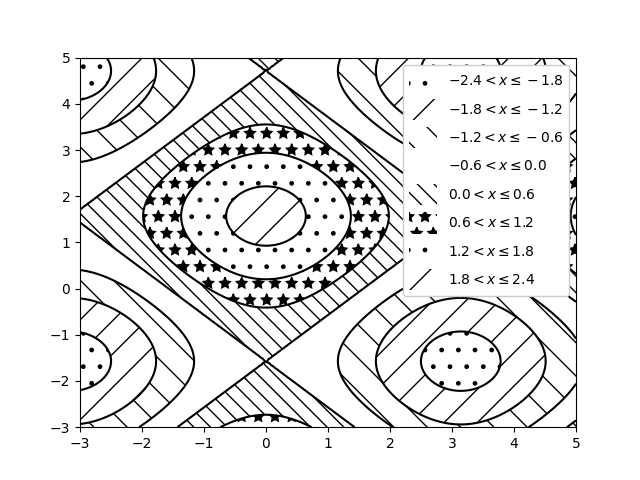
绘制2:没有带图例的颜色的阴影图
fig2, ax2 = plt.subplots()n_levels = 6ax2.contour(x, y, z, n_levels, colors='black', linestyles='-')cs = ax2.contourf(x, y, z, n_levels, colors='none',hatches=['.', '/', '\\', None, '\\\\', '*'],extend='lower')# create a legend for the contour setartists, labels = cs.legend_elements()ax2.legend(artists, labels, handleheight=2)plt.show()
参考
本例中显示了以下函数、方法和类的使用:
import matplotlibmatplotlib.axes.Axes.contourmatplotlib.pyplot.contourmatplotlib.axes.Axes.contourfmatplotlib.pyplot.contourfmatplotlib.figure.Figure.colorbarmatplotlib.pyplot.colorbarmatplotlib.axes.Axes.legendmatplotlib.pyplot.legendmatplotlib.contour.ContourSetmatplotlib.contour.ContourSet.legend_elements
下载这个示例

若有收获,就点个赞吧
0 人点赞
