绘制plot事件图的示例
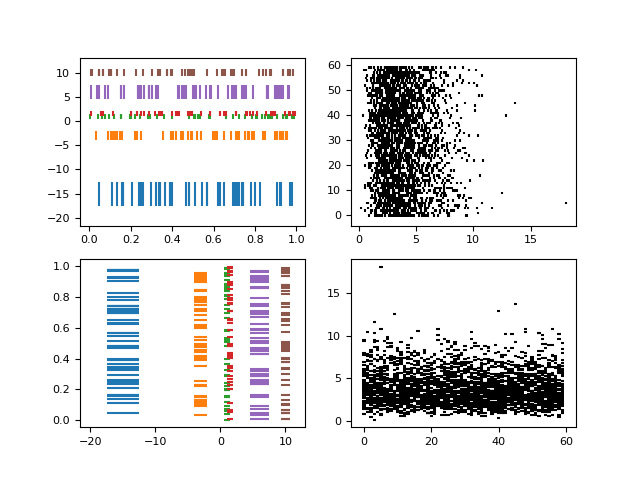
一个事件图,显示具有各种线属性的事件序列。该图以水平和垂直方向显示。
 ;
;
import matplotlib.pyplot as pltimport numpy as npimport matplotlibmatplotlib.rcParams['font.size'] = 8.0# Fixing random state for reproducibilitynp.random.seed(19680801)# create random datadata1 = np.random.random([6, 50])# set different colors for each set of positionscolors1 = np.array([[1, 0, 0],[0, 1, 0],[0, 0, 1],[1, 1, 0],[1, 0, 1],[0, 1, 1]])# set different line properties for each set of positions# note that some overlaplineoffsets1 = np.array([-15, -3, 1, 1.5, 6, 10])linelengths1 = [5, 2, 1, 1, 3, 1.5]fig, axs = plt.subplots(2, 2)# create a horizontal plotaxs[0, 0].eventplot(data1, colors=colors1, lineoffsets=lineoffsets1,linelengths=linelengths1)# create a vertical plotaxs[1, 0].eventplot(data1, colors=colors1, lineoffsets=lineoffsets1,linelengths=linelengths1, orientation='vertical')# create another set of random data.# the gamma distribution is only used fo aesthetic purposesdata2 = np.random.gamma(4, size=[60, 50])# use individual values for the parameters this time# these values will be used for all data sets (except lineoffsets2, which# sets the increment between each data set in this usage)colors2 = [[0, 0, 0]]lineoffsets2 = 1linelengths2 = 1# create a horizontal plotaxs[0, 1].eventplot(data2, colors=colors2, lineoffsets=lineoffsets2,linelengths=linelengths2)# create a vertical plotaxs[1, 1].eventplot(data2, colors=colors2, lineoffsets=lineoffsets2,linelengths=linelengths2, orientation='vertical')plt.show()
下载这个示例

若有收获,就点个赞吧
0 人点赞
