线段集合
使用Matplotlib绘制线条。
LineCollection 允许在图上绘制多条线。 下面我们展示它的一些属性。
import matplotlib.pyplot as pltfrom matplotlib.collections import LineCollectionfrom matplotlib import colors as mcolorsimport numpy as np# In order to efficiently plot many lines in a single set of axes,# Matplotlib has the ability to add the lines all at once. Here is a# simple example showing how it is done.x = np.arange(100)# Here are many sets of y to plot vs xys = x[:50, np.newaxis] + x[np.newaxis, :]segs = np.zeros((50, 100, 2))segs[:, :, 1] = yssegs[:, :, 0] = x# Mask some values to test masked array support:segs = np.ma.masked_where((segs > 50) & (segs < 60), segs)# We need to set the plot limits.fig, ax = plt.subplots()ax.set_xlim(x.min(), x.max())ax.set_ylim(ys.min(), ys.max())# colors is sequence of rgba tuples# linestyle is a string or dash tuple. Legal string values are# solid|dashed|dashdot|dotted. The dash tuple is (offset, onoffseq)# where onoffseq is an even length tuple of on and off ink in points.# If linestyle is omitted, 'solid' is used# See :class:`matplotlib.collections.LineCollection` for more informationcolors = [mcolors.to_rgba(c)for c in plt.rcParams['axes.prop_cycle'].by_key()['color']]line_segments = LineCollection(segs, linewidths=(0.5, 1, 1.5, 2),colors=colors, linestyle='solid')ax.add_collection(line_segments)ax.set_title('Line collection with masked arrays')plt.show()
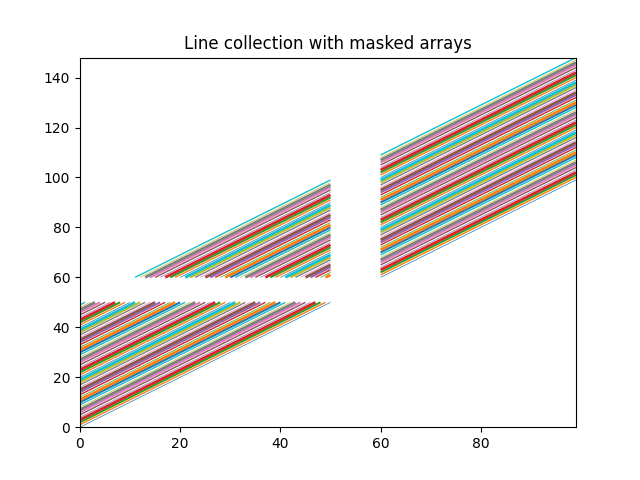
为了在一组轴中有效地绘制多条线,Matplotlib能够一次性添加所有线。 这是一个简单的例子,展示了它是如何完成的。
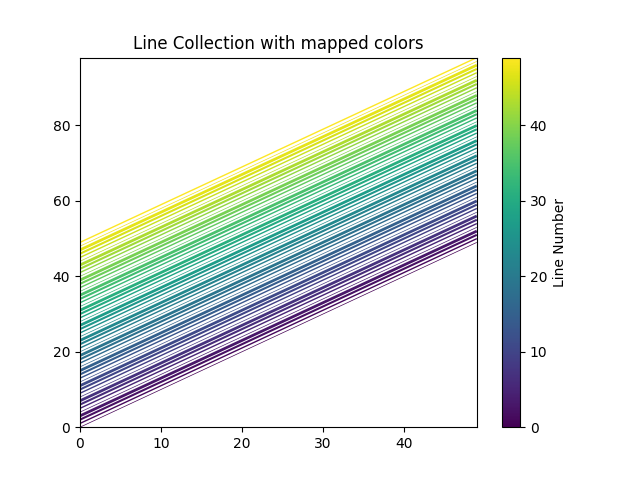
N = 50x = np.arange(N)# Here are many sets of y to plot vs xys = [x + i for i in x]# We need to set the plot limits, they will not autoscalefig, ax = plt.subplots()ax.set_xlim(np.min(x), np.max(x))ax.set_ylim(np.min(ys), np.max(ys))# colors is sequence of rgba tuples# linestyle is a string or dash tuple. Legal string values are# solid|dashed|dashdot|dotted. The dash tuple is (offset, onoffseq)# where onoffseq is an even length tuple of on and off ink in points.# If linestyle is omitted, 'solid' is used# See :class:`matplotlib.collections.LineCollection` for more information# Make a sequence of x,y pairsline_segments = LineCollection([np.column_stack([x, y]) for y in ys],linewidths=(0.5, 1, 1.5, 2),linestyles='solid')line_segments.set_array(x)ax.add_collection(line_segments)axcb = fig.colorbar(line_segments)axcb.set_label('Line Number')ax.set_title('Line Collection with mapped colors')plt.sci(line_segments) # This allows interactive changing of the colormap.plt.show()
参考
此示例中显示了以下函数,方法,类和模块的使用:
import matplotlibmatplotlib.collectionsmatplotlib.collections.LineCollectionmatplotlib.cm.ScalarMappable.set_arraymatplotlib.axes.Axes.add_collectionmatplotlib.figure.Figure.colorbarmatplotlib.pyplot.colorbarmatplotlib.pyplot.sci
下载这个示例

若有收获,就点个赞吧
0 人点赞
