散点图
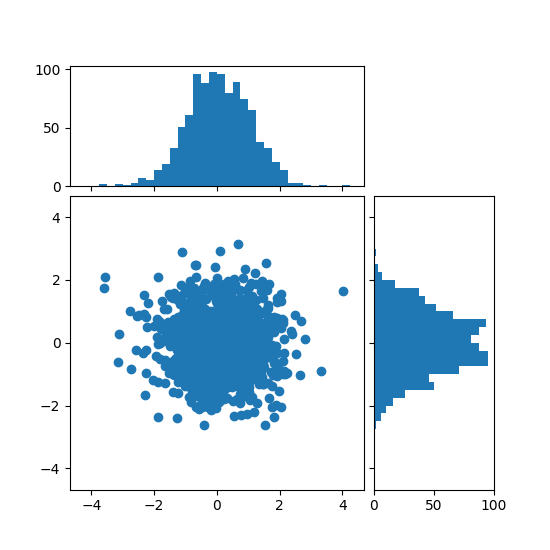
import numpy as npimport matplotlib.pyplot as pltfrom mpl_toolkits.axes_grid1 import make_axes_locatable# Fixing random state for reproducibilitynp.random.seed(19680801)# the random datax = np.random.randn(1000)y = np.random.randn(1000)fig, axScatter = plt.subplots(figsize=(5.5, 5.5))# the scatter plot:axScatter.scatter(x, y)axScatter.set_aspect(1.)# create new axes on the right and on the top of the current axes# The first argument of the new_vertical(new_horizontal) method is# the height (width) of the axes to be created in inches.divider = make_axes_locatable(axScatter)axHistx = divider.append_axes("top", 1.2, pad=0.1, sharex=axScatter)axHisty = divider.append_axes("right", 1.2, pad=0.1, sharey=axScatter)# make some labels invisibleaxHistx.xaxis.set_tick_params(labelbottom=False)axHisty.yaxis.set_tick_params(labelleft=False)# now determine nice limits by hand:binwidth = 0.25xymax = max(np.max(np.abs(x)), np.max(np.abs(y)))lim = (int(xymax/binwidth) + 1)*binwidthbins = np.arange(-lim, lim + binwidth, binwidth)axHistx.hist(x, bins=bins)axHisty.hist(y, bins=bins, orientation='horizontal')# the xaxis of axHistx and yaxis of axHisty are shared with axScatter,# thus there is no need to manually adjust the xlim and ylim of these# axis.axHistx.set_yticks([0, 50, 100])axHisty.set_xticks([0, 50, 100])plt.show()
下载这个示例

若有收获,就点个赞吧
0 人点赞
