Hexbin 演示
使用Matplotlib绘制hexbins。
Hexbin是一种轴方法或pyplot函数,它基本上是具有六边形单元的二维直方图的pcolor。 它可以比散点图更具信息性。 在下面的第一个图中,尝试用’scatter’代替’hexbin’。
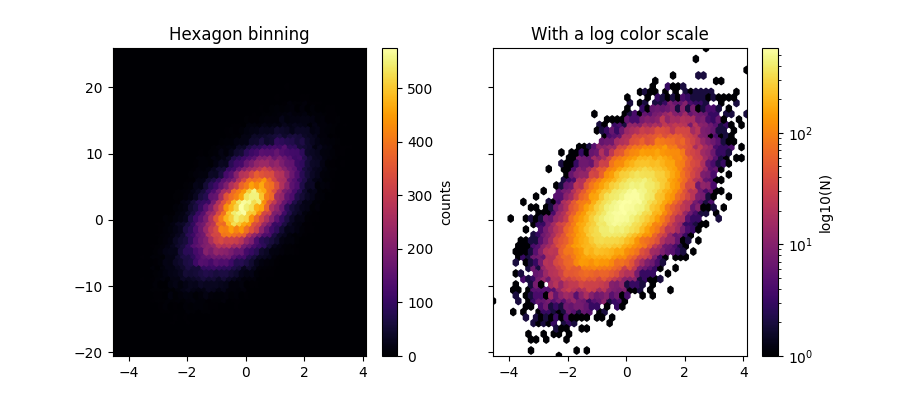
import numpy as npimport matplotlib.pyplot as plt# Fixing random state for reproducibilitynp.random.seed(19680801)n = 100000x = np.random.standard_normal(n)y = 2.0 + 3.0 * x + 4.0 * np.random.standard_normal(n)xmin = x.min()xmax = x.max()ymin = y.min()ymax = y.max()fig, axs = plt.subplots(ncols=2, sharey=True, figsize=(7, 4))fig.subplots_adjust(hspace=0.5, left=0.07, right=0.93)ax = axs[0]hb = ax.hexbin(x, y, gridsize=50, cmap='inferno')ax.axis([xmin, xmax, ymin, ymax])ax.set_title("Hexagon binning")cb = fig.colorbar(hb, ax=ax)cb.set_label('counts')ax = axs[1]hb = ax.hexbin(x, y, gridsize=50, bins='log', cmap='inferno')ax.axis([xmin, xmax, ymin, ymax])ax.set_title("With a log color scale")cb = fig.colorbar(hb, ax=ax)cb.set_label('log10(N)')plt.show()
下载这个示例

若有收获,就点个赞吧
0 人点赞
