基本颜色演示
Matplotlib为您提供了8种指定颜色的方法:
- 在[0, 1]中的浮点值的RGB或RGBA元组(例如 (0.1, 0.2, 0.5) 或 (0.1, 0.2, 0.5, 0.3))。RGBA是红色,绿色,蓝色,Alpha的缩写;
- 十六进制RGB或RGBA字符串
(例如: '#0F0F0F' 或者 '#0F0F0F0F'); - [0, 1]中浮点值的字符串表示,包括灰度级(例如,’0.5’);
- 单字母字符串,例如这些其中之一:
{'b', 'g', 'r', 'c', 'm', 'y', 'k', 'w'}; - 一个 X11/CSS4 (“html”) 颜色名称, 例如:”blue”;
- 来自xkcd的颜色调研的名称,前缀为 ‘xkcd:’ (例如:“xkcd:sky blue”);
- 一个 “Cn” 颜色规范,即 ‘C’ 后跟一个数字,这是默认属性循环的索引(
matplotlib.rcParams['axes.prop_cycle']); 索引在艺术家对象创建时发生,如果循环不包括颜色,则默认为黑色。 - 其中一个
{'tab:blue', 'tab:orange', 'tab:green', 'tab:red', 'tab:purple', 'tab:brown', 'tab:pink', 'tab:gray', 'tab:olive', 'tab:cyan'},它们是’tab10’分类调色板中的Tableau颜色(这是默认的颜色循环);
有关matplotlib中颜色的更多信息,请参阅:
- 指定颜色教程;
- matplotlib.colors API;
- 可视化命名颜色示例。
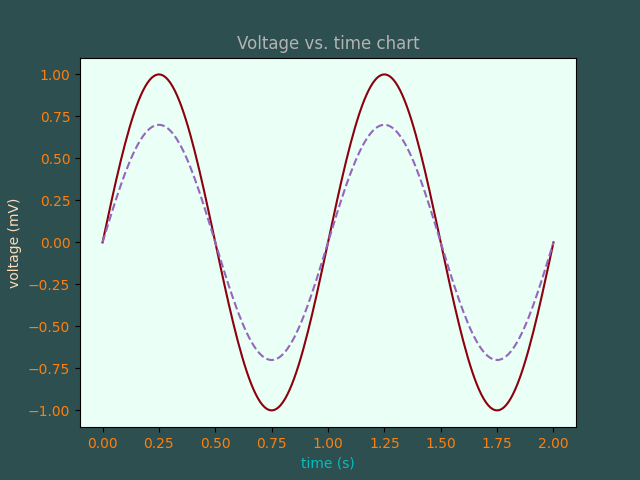
import matplotlib.pyplot as pltimport numpy as npt = np.linspace(0.0, 2.0, 201)s = np.sin(2 * np.pi * t)# 1) RGB tuple:fig, ax = plt.subplots(facecolor=(.18, .31, .31))# 2) hex string:ax.set_facecolor('#eafff5')# 3) gray level string:ax.set_title('Voltage vs. time chart', color='0.7')# 4) single letter color stringax.set_xlabel('time (s)', color='c')# 5) a named color:ax.set_ylabel('voltage (mV)', color='peachpuff')# 6) a named xkcd color:ax.plot(t, s, 'xkcd:crimson')# 7) Cn notation:ax.plot(t, .7*s, color='C4', linestyle='--')# 8) tab notation:ax.tick_params(labelcolor='tab:orange')plt.show()
参考
此示例中显示了以下函数,方法,类和模块的使用:
import matplotlibmatplotlib.colorsmatplotlib.axes.Axes.plotmatplotlib.axes.Axes.set_facecolormatplotlib.axes.Axes.set_titlematplotlib.axes.Axes.set_xlabelmatplotlib.axes.Axes.set_ylabelmatplotlib.axes.Axes.tick_params
下载这个示例

若有收获,就点个赞吧
0 人点赞
