刻度定位器
显示不同的刻度定位器。
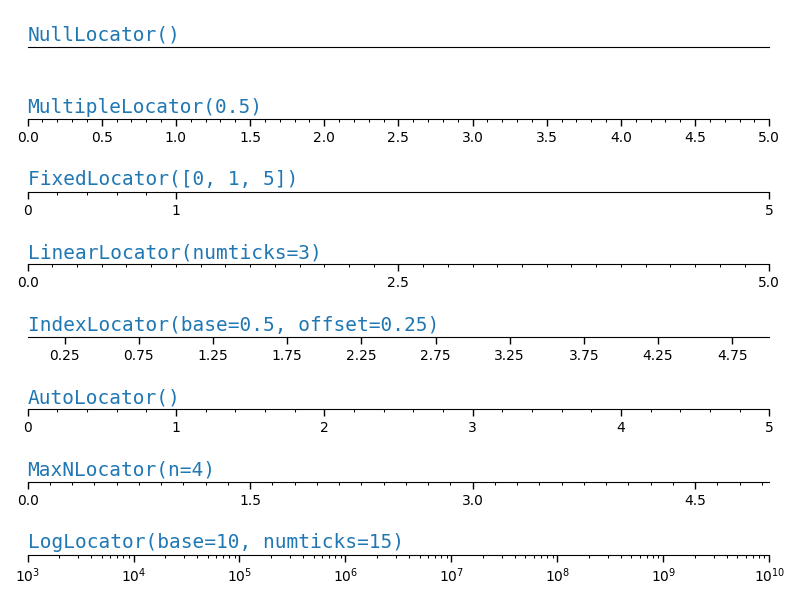
import numpy as npimport matplotlib.pyplot as pltimport matplotlib.ticker as ticker# Setup a plot such that only the bottom spine is showndef setup(ax):ax.spines['right'].set_color('none')ax.spines['left'].set_color('none')ax.yaxis.set_major_locator(ticker.NullLocator())ax.spines['top'].set_color('none')ax.xaxis.set_ticks_position('bottom')ax.tick_params(which='major', width=1.00)ax.tick_params(which='major', length=5)ax.tick_params(which='minor', width=0.75)ax.tick_params(which='minor', length=2.5)ax.set_xlim(0, 5)ax.set_ylim(0, 1)ax.patch.set_alpha(0.0)plt.figure(figsize=(8, 6))n = 8# Null Locatorax = plt.subplot(n, 1, 1)setup(ax)ax.xaxis.set_major_locator(ticker.NullLocator())ax.xaxis.set_minor_locator(ticker.NullLocator())ax.text(0.0, 0.1, "NullLocator()", fontsize=14, transform=ax.transAxes)# Multiple Locatorax = plt.subplot(n, 1, 2)setup(ax)ax.xaxis.set_major_locator(ticker.MultipleLocator(0.5))ax.xaxis.set_minor_locator(ticker.MultipleLocator(0.1))ax.text(0.0, 0.1, "MultipleLocator(0.5)", fontsize=14,transform=ax.transAxes)# Fixed Locatorax = plt.subplot(n, 1, 3)setup(ax)majors = [0, 1, 5]ax.xaxis.set_major_locator(ticker.FixedLocator(majors))minors = np.linspace(0, 1, 11)[1:-1]ax.xaxis.set_minor_locator(ticker.FixedLocator(minors))ax.text(0.0, 0.1, "FixedLocator([0, 1, 5])", fontsize=14,transform=ax.transAxes)# Linear Locatorax = plt.subplot(n, 1, 4)setup(ax)ax.xaxis.set_major_locator(ticker.LinearLocator(3))ax.xaxis.set_minor_locator(ticker.LinearLocator(31))ax.text(0.0, 0.1, "LinearLocator(numticks=3)",fontsize=14, transform=ax.transAxes)# Index Locatorax = plt.subplot(n, 1, 5)setup(ax)ax.plot(range(0, 5), [0]*5, color='White')ax.xaxis.set_major_locator(ticker.IndexLocator(base=.5, offset=.25))ax.text(0.0, 0.1, "IndexLocator(base=0.5, offset=0.25)",fontsize=14, transform=ax.transAxes)# Auto Locatorax = plt.subplot(n, 1, 6)setup(ax)ax.xaxis.set_major_locator(ticker.AutoLocator())ax.xaxis.set_minor_locator(ticker.AutoMinorLocator())ax.text(0.0, 0.1, "AutoLocator()", fontsize=14, transform=ax.transAxes)# MaxN Locatorax = plt.subplot(n, 1, 7)setup(ax)ax.xaxis.set_major_locator(ticker.MaxNLocator(4))ax.xaxis.set_minor_locator(ticker.MaxNLocator(40))ax.text(0.0, 0.1, "MaxNLocator(n=4)", fontsize=14, transform=ax.transAxes)# Log Locatorax = plt.subplot(n, 1, 8)setup(ax)ax.set_xlim(10**3, 10**10)ax.set_xscale('log')ax.xaxis.set_major_locator(ticker.LogLocator(base=10.0, numticks=15))ax.text(0.0, 0.1, "LogLocator(base=10, numticks=15)",fontsize=15, transform=ax.transAxes)# Push the top of the top axes outside the figure because we only show the# bottom spine.plt.subplots_adjust(left=0.05, right=0.95, bottom=0.05, top=1.05)plt.show()
下载这个示例

若有收获,就点个赞吧
0 人点赞
