流图
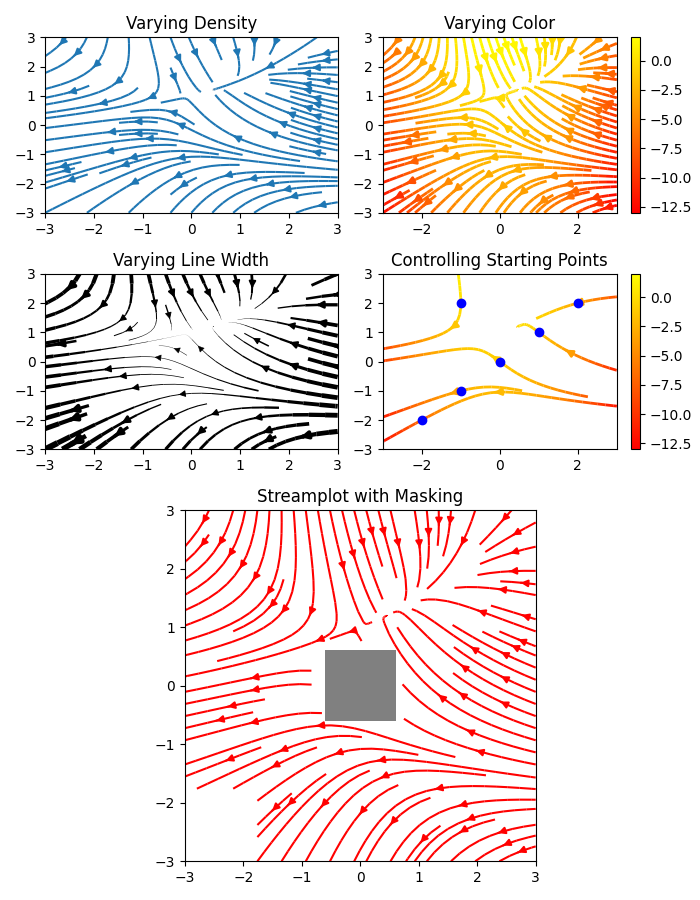
流图或流线图用于显示2D矢量场。此示例显示了 streamplot() 函数的一些功能:
- 沿着流线改变颜色。
- 改变流线的密度。
- 沿流线改变线宽。
- 控制流线的起点。
- 流线跳过蒙面区域和NaN值。
import numpy as npimport matplotlib.pyplot as pltimport matplotlib.gridspec as gridspecw = 3Y, X = np.mgrid[-w:w:100j, -w:w:100j]U = -1 - X**2 + YV = 1 + X - Y**2speed = np.sqrt(U*U + V*V)fig = plt.figure(figsize=(7, 9))gs = gridspec.GridSpec(nrows=3, ncols=2, height_ratios=[1, 1, 2])# Varying density along a streamlineax0 = fig.add_subplot(gs[0, 0])ax0.streamplot(X, Y, U, V, density=[0.5, 1])ax0.set_title('Varying Density')# Varying color along a streamlineax1 = fig.add_subplot(gs[0, 1])strm = ax1.streamplot(X, Y, U, V, color=U, linewidth=2, cmap='autumn')fig.colorbar(strm.lines)ax1.set_title('Varying Color')# Varying line width along a streamlineax2 = fig.add_subplot(gs[1, 0])lw = 5*speed / speed.max()ax2.streamplot(X, Y, U, V, density=0.6, color='k', linewidth=lw)ax2.set_title('Varying Line Width')# Controlling the starting points of the streamlinesseed_points = np.array([[-2, -1, 0, 1, 2, -1], [-2, -1, 0, 1, 2, 2]])ax3 = fig.add_subplot(gs[1, 1])strm = ax3.streamplot(X, Y, U, V, color=U, linewidth=2,cmap='autumn', start_points=seed_points.T)fig.colorbar(strm.lines)ax3.set_title('Controlling Starting Points')# Displaying the starting points with blue symbols.ax3.plot(seed_points[0], seed_points[1], 'bo')ax3.axis((-w, w, -w, w))# Create a maskmask = np.zeros(U.shape, dtype=bool)mask[40:60, 40:60] = TrueU[:20, :20] = np.nanU = np.ma.array(U, mask=mask)ax4 = fig.add_subplot(gs[2:, :])ax4.streamplot(X, Y, U, V, color='r')ax4.set_title('Streamplot with Masking')ax4.imshow(~mask, extent=(-w, w, -w, w), alpha=0.5,interpolation='nearest', cmap='gray', aspect='auto')ax4.set_aspect('equal')plt.tight_layout()plt.show()
参考
下面的示例演示了以下函数和方法的使用:
import matplotlibmatplotlib.axes.Axes.streamplotmatplotlib.pyplot.streamplotmatplotlib.gridspecmatplotlib.gridspec.GridSpecTotal running time of the script: ( 0 minutes 1.403 seconds)
下载这个示例

若有收获,就点个赞吧
0 人点赞
