BboxImage 演示
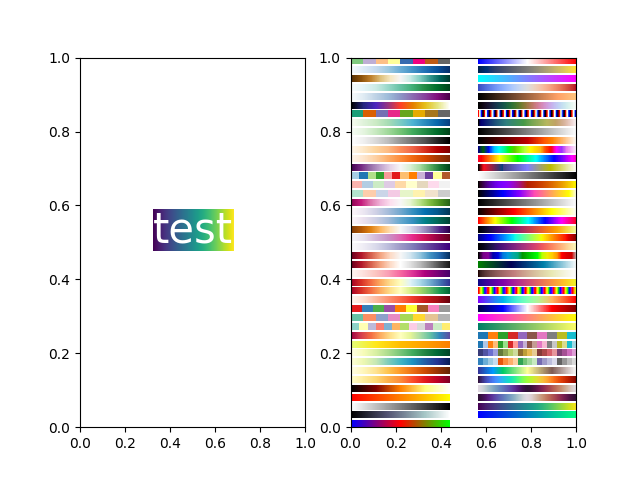
BboxImage可用于根据边界框定位图像。此演示演示如何在text.Text的边界框内显示图像以及如何手动为图像创建边界框。
import matplotlib.pyplot as pltimport numpy as npfrom matplotlib.image import BboxImagefrom matplotlib.transforms import Bbox, TransformedBboxfig, (ax1, ax2) = plt.subplots(ncols=2)# ----------------------------# Create a BboxImage with Text# ----------------------------txt = ax1.text(0.5, 0.5, "test", size=30, ha="center", color="w")kwargs = dict()bbox_image = BboxImage(txt.get_window_extent,norm=None,origin=None,clip_on=False,**kwargs)a = np.arange(256).reshape(1, 256)/256.bbox_image.set_data(a)ax1.add_artist(bbox_image)# ------------------------------------# Create a BboxImage for each colormap# ------------------------------------a = np.linspace(0, 1, 256).reshape(1, -1)a = np.vstack((a, a))# List of all colormaps; skip reversed colormaps.maps = sorted(m for m in plt.cm.cmap_d if not m.endswith("_r"))ncol = 2nrow = len(maps)//ncol + 1xpad_fraction = 0.3dx = 1./(ncol + xpad_fraction*(ncol - 1))ypad_fraction = 0.3dy = 1./(nrow + ypad_fraction*(nrow - 1))for i, m in enumerate(maps):ix, iy = divmod(i, nrow)bbox0 = Bbox.from_bounds(ix*dx*(1 + xpad_fraction),1. - iy*dy*(1 + ypad_fraction) - dy,dx, dy)bbox = TransformedBbox(bbox0, ax2.transAxes)bbox_image = BboxImage(bbox,cmap=plt.get_cmap(m),norm=None,origin=None,**kwargs)bbox_image.set_data(a)ax2.add_artist(bbox_image)plt.show()
参考
此示例中显示了以下函数,方法,类和模块的使用:
import matplotlibmatplotlib.image.BboxImagematplotlib.transforms.Bboxmatplotlib.transforms.TransformedBboxmatplotlib.text.Text
下载这个示例

若有收获,就点个赞吧
0 人点赞
