重采样数据
下采样会降低信号的采样率或采样大小。在本教程中,当通过拖动和缩放调整打印时,将对信号进行缩减采样。
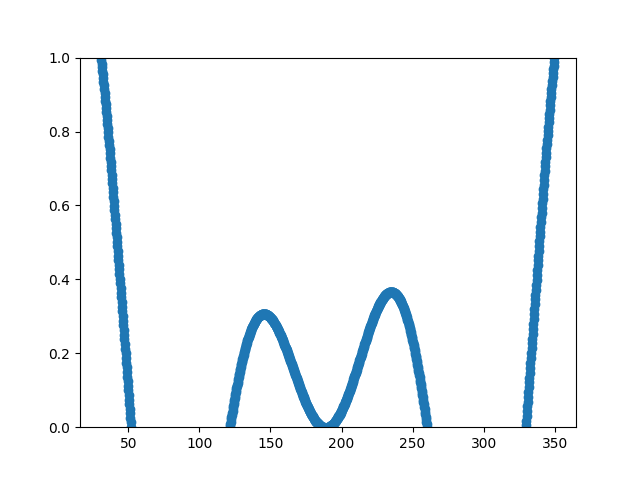
import numpy as npimport matplotlib.pyplot as plt# A class that will downsample the data and recompute when zoomed.class DataDisplayDownsampler(object):def __init__(self, xdata, ydata):self.origYData = ydataself.origXData = xdataself.max_points = 50self.delta = xdata[-1] - xdata[0]def downsample(self, xstart, xend):# get the points in the view rangemask = (self.origXData > xstart) & (self.origXData < xend)# dilate the mask by one to catch the points just outside# of the view range to not truncate the linemask = np.convolve([1, 1], mask, mode='same').astype(bool)# sort out how many points to dropratio = max(np.sum(mask) // self.max_points, 1)# mask dataxdata = self.origXData[mask]ydata = self.origYData[mask]# downsample dataxdata = xdata[::ratio]ydata = ydata[::ratio]print("using {} of {} visible points".format(len(ydata), np.sum(mask)))return xdata, ydatadef update(self, ax):# Update the linelims = ax.viewLimif np.abs(lims.width - self.delta) > 1e-8:self.delta = lims.widthxstart, xend = lims.intervalxself.line.set_data(*self.downsample(xstart, xend))ax.figure.canvas.draw_idle()# Create a signalxdata = np.linspace(16, 365, (365-16)*4)ydata = np.sin(2*np.pi*xdata/153) + np.cos(2*np.pi*xdata/127)d = DataDisplayDownsampler(xdata, ydata)fig, ax = plt.subplots()# Hook up the lined.line, = ax.plot(xdata, ydata, 'o-')ax.set_autoscale_on(False) # Otherwise, infinite loop# Connect for changing the view limitsax.callbacks.connect('xlim_changed', d.update)ax.set_xlim(16, 365)plt.show()
下载这个示例

若有收获,就点个赞吧
0 人点赞
