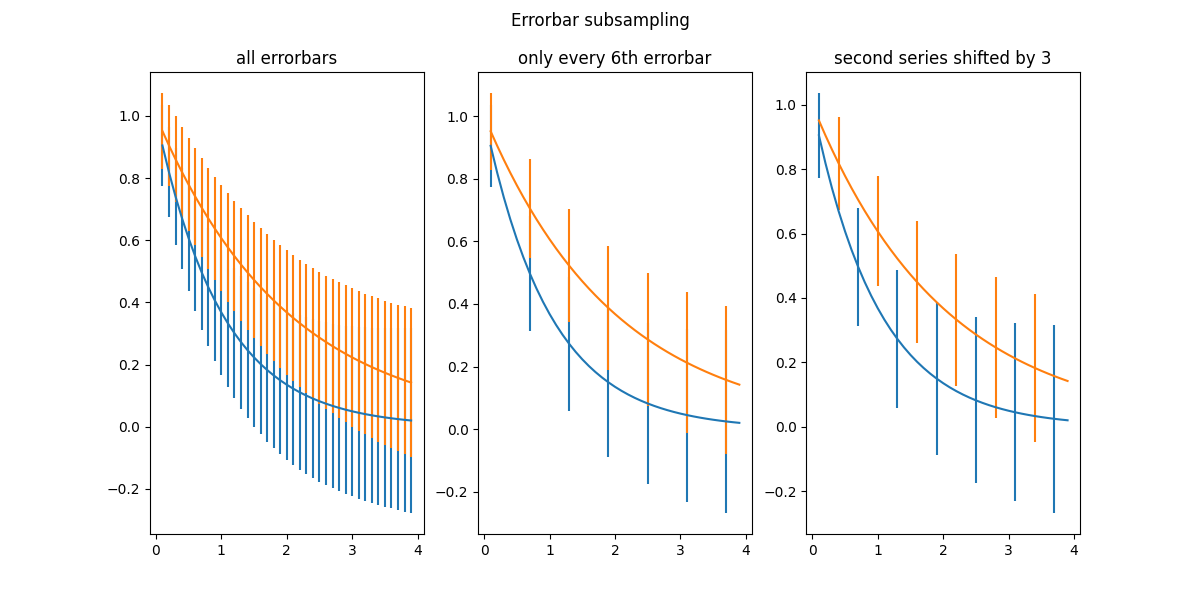
绘制误差条形图子样本
演示 errorevery 关键字,以显示数据的完全精度数据图与很少的误差条。
 ;
;
import numpy as npimport matplotlib.pyplot as plt# example datax = np.arange(0.1, 4, 0.1)y = np.exp(-x)# example variable error bar valuesyerr = 0.1 + 0.1 * np.sqrt(x)# Now switch to a more OO interface to exercise more features.fig, axs = plt.subplots(nrows=1, ncols=2, sharex=True)ax = axs[0]ax.errorbar(x, y, yerr=yerr)ax.set_title('all errorbars')ax = axs[1]ax.errorbar(x, y, yerr=yerr, errorevery=5)ax.set_title('only every 5th errorbar')fig.suptitle('Errorbar subsampling for better appearance')plt.show()
下载这个示例

若有收获,就点个赞吧
0 人点赞
