相同图中的2D和3D轴
此示例显示如何在同一图上绘制2D和3D绘图。
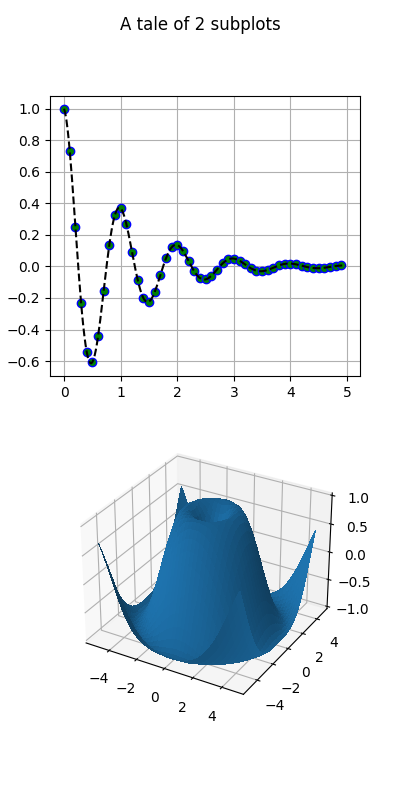
# This import registers the 3D projection, but is otherwise unused.from mpl_toolkits.mplot3d import Axes3D # noqa: F401 unused importimport matplotlib.pyplot as pltimport numpy as npdef f(t):s1 = np.cos(2*np.pi*t)e1 = np.exp(-t)return np.multiply(s1, e1)# Set up a figure twice as tall as it is widefig = plt.figure(figsize=plt.figaspect(2.))fig.suptitle('A tale of 2 subplots')# First subplotax = fig.add_subplot(2, 1, 1)t1 = np.arange(0.0, 5.0, 0.1)t2 = np.arange(0.0, 5.0, 0.02)t3 = np.arange(0.0, 2.0, 0.01)ax.plot(t1, f(t1), 'bo',t2, f(t2), 'k--', markerfacecolor='green')ax.grid(True)ax.set_ylabel('Damped oscillation')# Second subplotax = fig.add_subplot(2, 1, 2, projection='3d')X = np.arange(-5, 5, 0.25)Y = np.arange(-5, 5, 0.25)X, Y = np.meshgrid(X, Y)R = np.sqrt(X**2 + Y**2)Z = np.sin(R)surf = ax.plot_surface(X, Y, Z, rstride=1, cstride=1,linewidth=0, antialiased=False)ax.set_zlim(-1, 1)plt.show()
下载这个示例

若有收获,就点个赞吧
0 人点赞
