散点图遮盖
屏蔽一些数据点,并添加一条线去标记掩码区域。
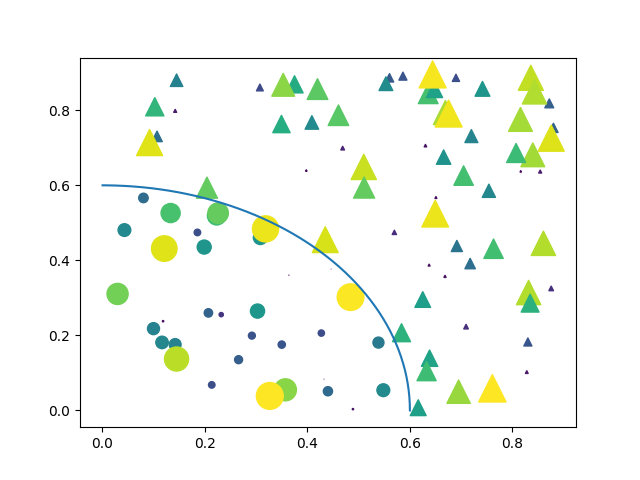
import matplotlib.pyplot as pltimport numpy as np# Fixing random state for reproducibilitynp.random.seed(19680801)N = 100r0 = 0.6x = 0.9 * np.random.rand(N)y = 0.9 * np.random.rand(N)area = (20 * np.random.rand(N))**2 # 0 to 10 point radiic = np.sqrt(area)r = np.sqrt(x * x + y * y)area1 = np.ma.masked_where(r < r0, area)area2 = np.ma.masked_where(r >= r0, area)plt.scatter(x, y, s=area1, marker='^', c=c)plt.scatter(x, y, s=area2, marker='o', c=c)# Show the boundary between the regions:theta = np.arange(0, np.pi / 2, 0.01)plt.plot(r0 * np.cos(theta), r0 * np.sin(theta))plt.show()
下载这个示例

若有收获,就点个赞吧
0 人点赞
