绘制不同的文本
绘制许多不同种类的文本。
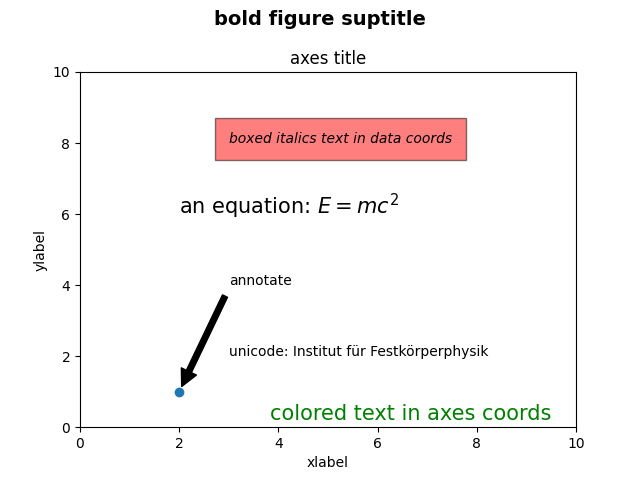
import matplotlib.pyplot as pltfig = plt.figure()fig.suptitle('bold figure suptitle', fontsize=14, fontweight='bold')ax = fig.add_subplot(111)fig.subplots_adjust(top=0.85)ax.set_title('axes title')ax.set_xlabel('xlabel')ax.set_ylabel('ylabel')ax.text(3, 8, 'boxed italics text in data coords', style='italic',bbox={'facecolor':'red', 'alpha':0.5, 'pad':10})ax.text(2, 6, r'an equation: $E=mc^2$', fontsize=15)ax.text(3, 2, 'unicode: Institut f\374r Festk\366rperphysik')ax.text(0.95, 0.01, 'colored text in axes coords',verticalalignment='bottom', horizontalalignment='right',transform=ax.transAxes,color='green', fontsize=15)ax.plot([2], [1], 'o')ax.annotate('annotate', xy=(2, 1), xytext=(3, 4),arrowprops=dict(facecolor='black', shrink=0.05))ax.axis([0, 10, 0, 10])plt.show()
参考
此示例中显示了以下函数,方法,类和模块的使用:
import matplotlibmatplotlib.figure.Figure.suptitlematplotlib.figure.Figure.add_subplotmatplotlib.figure.Figure.subplots_adjustmatplotlib.axes.Axes.set_titlematplotlib.axes.Axes.set_xlabelmatplotlib.axes.Axes.set_ylabelmatplotlib.axes.Axes.textmatplotlib.axes.Axes.annotate
下载这个示例

若有收获,就点个赞吧
0 人点赞
