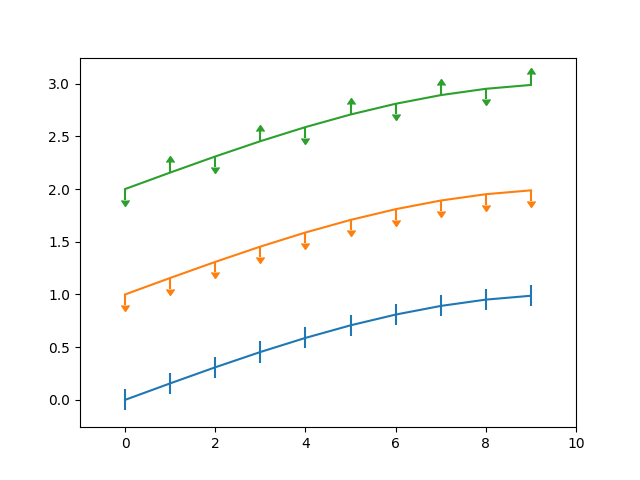
绘制限制型误差条形图
误差条上的上限符号和下限符号的说明
import numpy as npimport matplotlib.pyplot as plt
fig = plt.figure(0)x = np.arange(10.0)y = np.sin(np.arange(10.0) / 20.0 * np.pi)plt.errorbar(x, y, yerr=0.1)y = np.sin(np.arange(10.0) / 20.0 * np.pi) + 1plt.errorbar(x, y, yerr=0.1, uplims=True)y = np.sin(np.arange(10.0) / 20.0 * np.pi) + 2upperlimits = np.array([1, 0] * 5)lowerlimits = np.array([0, 1] * 5)plt.errorbar(x, y, yerr=0.1, uplims=upperlimits, lolims=lowerlimits)plt.xlim(-1, 10)
 ;
;
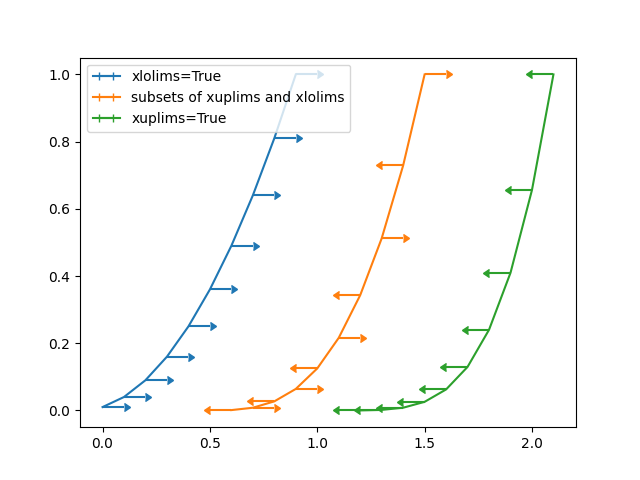
fig = plt.figure(1)x = np.arange(10.0) / 10.0y = (x + 0.1)**2plt.errorbar(x, y, xerr=0.1, xlolims=True)y = (x + 0.1)**3plt.errorbar(x + 0.6, y, xerr=0.1, xuplims=upperlimits, xlolims=lowerlimits)y = (x + 0.1)**4plt.errorbar(x + 1.2, y, xerr=0.1, xuplims=True)plt.xlim(-0.2, 2.4)plt.ylim(-0.1, 1.3)plt.show()
 ;
;
下载这个示例

若有收获,就点个赞吧
0 人点赞
