标记参考
使用Matplotlib参考填充,未填充和自定义标记类型。
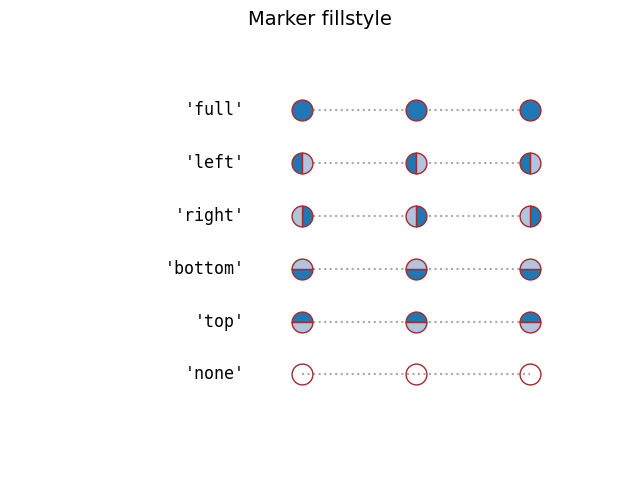
有关所有标记的列表,请参阅 matplotlib.markers 文档。 另请参阅 标记填充样式 和 标记路径示例。
import numpy as npimport matplotlib.pyplot as pltfrom matplotlib.lines import Line2Dpoints = np.ones(3) # Draw 3 points for each linetext_style = dict(horizontalalignment='right', verticalalignment='center',fontsize=12, fontdict={'family': 'monospace'})marker_style = dict(linestyle=':', color='0.8', markersize=10,mfc="C0", mec="C0")def format_axes(ax):ax.margins(0.2)ax.set_axis_off()ax.invert_yaxis()def nice_repr(text):return repr(text).lstrip('u')def math_repr(text):tx = repr(text).lstrip('u').strip("'").strip("$")return r"'\${}\$'".format(tx)def split_list(a_list):i_half = len(a_list) // 2return (a_list[:i_half], a_list[i_half:])
填充和未填充标记类型
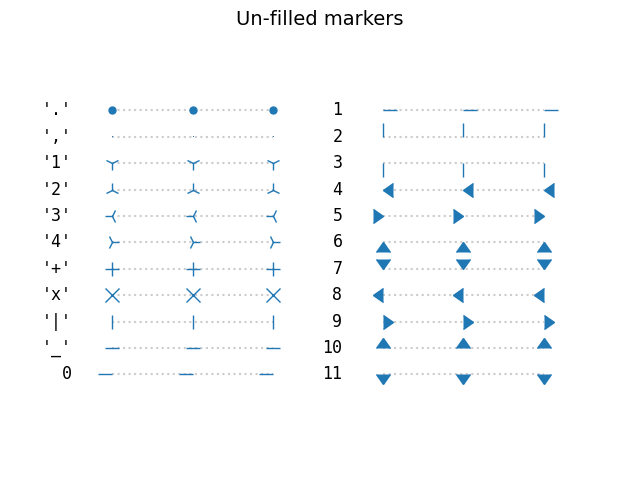
绘制所有未填充的标记
fig, axes = plt.subplots(ncols=2)fig.suptitle('un-filled markers', fontsize=14)# Filter out filled markers and marker settings that do nothing.unfilled_markers = [m for m, func in Line2D.markers.items()if func != 'nothing' and m not in Line2D.filled_markers]for ax, markers in zip(axes, split_list(unfilled_markers)):for y, marker in enumerate(markers):ax.text(-0.5, y, nice_repr(marker), **text_style)ax.plot(y * points, marker=marker, **marker_style)format_axes(ax)plt.show()
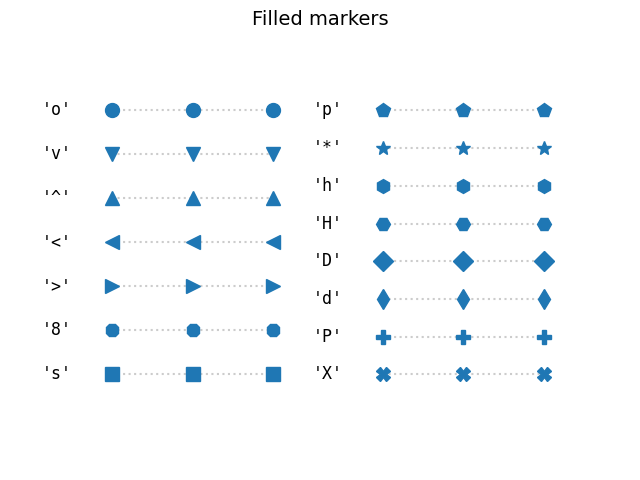
绘制所有填满的标记。
fig, axes = plt.subplots(ncols=2)for ax, markers in zip(axes, split_list(Line2D.filled_markers)):for y, marker in enumerate(markers):ax.text(-0.5, y, nice_repr(marker), **text_style)ax.plot(y * points, marker=marker, **marker_style)format_axes(ax)fig.suptitle('filled markers', fontsize=14)plt.show()
带有MathText的自定义标记
使用MathText,使用自定义标记符号,例如“$\$ u266B”。有关STIX字体符号的概述,请参阅STIX字体表。另请参阅STIX字体演示。
fig, ax = plt.subplots()fig.subplots_adjust(left=0.4)marker_style.update(mec="None", markersize=15)markers = ["$1$", r"$\frac{1}{2}$", "$f$", "$\u266B$",r"$\mathcircled{m}$"]for y, marker in enumerate(markers):ax.text(-0.5, y, math_repr(marker), **text_style)ax.plot(y * points, marker=marker, **marker_style)format_axes(ax)plt.show()
下载这个示例

若有收获,就点个赞吧
0 人点赞
