简单的轴线网格
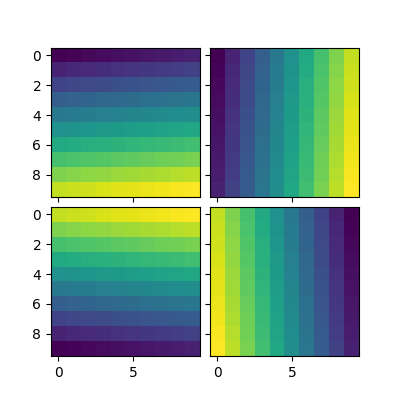
import matplotlib.pyplot as pltfrom mpl_toolkits.axes_grid1 import ImageGridimport numpy as npim = np.arange(100).reshape((10, 10))fig = plt.figure(1, (4., 4.))grid = ImageGrid(fig, 111, # similar to subplot(111)nrows_ncols=(2, 2), # creates 2x2 grid of axesaxes_pad=0.1, # pad between axes in inch.)for i in range(4):grid[i].imshow(im) # The AxesGrid object work as a list of axes.plt.show()
下载这个示例

若有收获,就点个赞吧
0 人点赞
