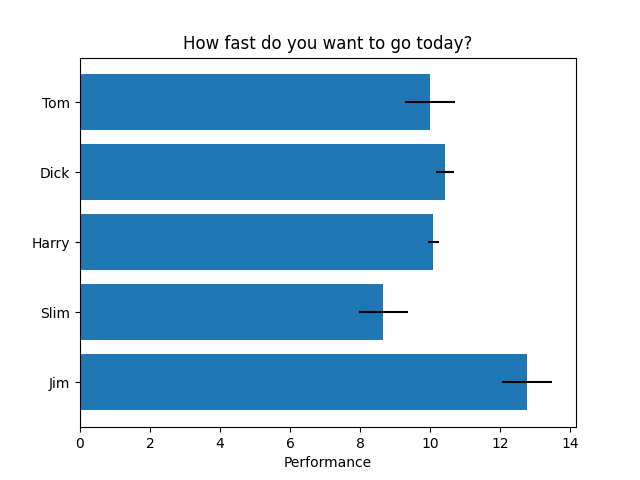
水平条形图
这个例子展示了一个简单的水平条形图。
 ;
;
import matplotlib.pyplot as pltimport numpy as np# Fixing random state for reproducibilitynp.random.seed(19680801)plt.rcdefaults()fig, ax = plt.subplots()# Example datapeople = ('Tom', 'Dick', 'Harry', 'Slim', 'Jim')y_pos = np.arange(len(people))performance = 3 + 10 * np.random.rand(len(people))error = np.random.rand(len(people))ax.barh(y_pos, performance, xerr=error, align='center',color='green', ecolor='black')ax.set_yticks(y_pos)ax.set_yticklabels(people)ax.invert_yaxis() # labels read top-to-bottomax.set_xlabel('Performance')ax.set_title('How fast do you want to go today?')plt.show()
下载这个示例

若有收获,就点个赞吧
0 人点赞
