具有圆柱坐标的3D体素/体积图
演示使用ax.voxels的x,y,z参数。
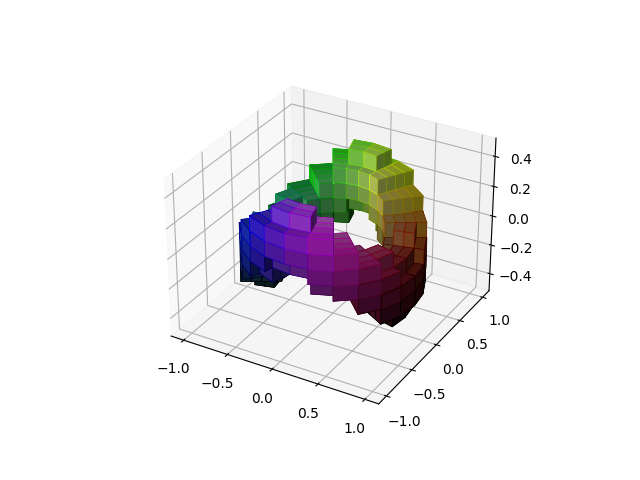
import matplotlib.pyplot as pltimport matplotlib.colorsimport numpy as np# This import registers the 3D projection, but is otherwise unused.from mpl_toolkits.mplot3d import Axes3D # noqa: F401 unused importdef midpoints(x):sl = ()for i in range(x.ndim):x = (x[sl + np.index_exp[:-1]] + x[sl + np.index_exp[1:]]) / 2.0sl += np.index_exp[:]return x# prepare some coordinates, and attach rgb values to eachr, theta, z = np.mgrid[0:1:11j, 0:np.pi*2:25j, -0.5:0.5:11j]x = r*np.cos(theta)y = r*np.sin(theta)rc, thetac, zc = midpoints(r), midpoints(theta), midpoints(z)# define a wobbly torus about [0.7, *, 0]sphere = (rc - 0.7)**2 + (zc + 0.2*np.cos(thetac*2))**2 < 0.2**2# combine the color componentshsv = np.zeros(sphere.shape + (3,))hsv[..., 0] = thetac / (np.pi*2)hsv[..., 1] = rchsv[..., 2] = zc + 0.5colors = matplotlib.colors.hsv_to_rgb(hsv)# and plot everythingfig = plt.figure()ax = fig.gca(projection='3d')ax.voxels(x, y, z, sphere,facecolors=colors,edgecolors=np.clip(2*colors - 0.5, 0, 1), # brighterlinewidth=0.5)plt.show()
下载这个示例

若有收获,就点个赞吧
0 人点赞
