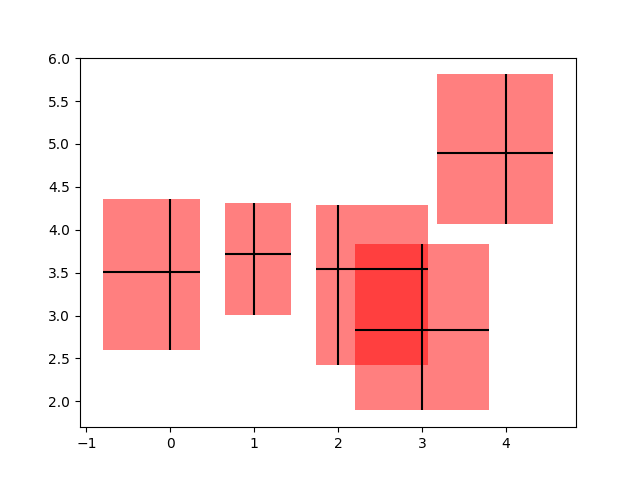
使用PatchCollection在误差图中创建箱型图
在这个例子中,我们通过在x方向和y方向上添加由条形极限定义的矩形块来拼写一个非常标准的误差条形图。为此,我们必须编写自己的自定义函数 make_error_boxes。仔细检查此函数将揭示matplotlib编写函数的首选模式:
- an Axes object is passed directly to the function
- the function operates on the Axes methods directly, not through the
pyplotinterface - plotting kwargs that could be abbreviated are spelled out for better code readability in the future (for example we use
facecolorinstead of fc) - the artists returned by the Axes plotting methods are then returned by the function so that, if desired, their styles can be modified later outside of the function (they are not modified in this example).
import numpy as npimport matplotlib.pyplot as pltfrom matplotlib.collections import PatchCollectionfrom matplotlib.patches import Rectangle# Number of data pointsn = 5# Dummy datanp.random.seed(19680801)x = np.arange(0, n, 1)y = np.random.rand(n) * 5.# Dummy errors (above and below)xerr = np.random.rand(2, n) + 0.1yerr = np.random.rand(2, n) + 0.2def make_error_boxes(ax, xdata, ydata, xerror, yerror, facecolor='r',edgecolor='None', alpha=0.5):# Create list for all the error patcheserrorboxes = []# Loop over data points; create box from errors at each pointfor x, y, xe, ye in zip(xdata, ydata, xerror.T, yerror.T):rect = Rectangle((x - xe[0], y - ye[0]), xe.sum(), ye.sum())errorboxes.append(rect)# Create patch collection with specified colour/alphapc = PatchCollection(errorboxes, facecolor=facecolor, alpha=alpha,edgecolor=edgecolor)# Add collection to axesax.add_collection(pc)# Plot errorbarsartists = ax.errorbar(xdata, ydata, xerr=xerror, yerr=yerror,fmt='None', ecolor='k')return artists# Create figure and axesfig, ax = plt.subplots(1)# Call function to create error boxes_ = make_error_boxes(ax, x, y, xerr, yerr)plt.show()
下载这个示例

若有收获,就点个赞吧
0 人点赞
