填充直方图
用于绘制直方图的剖面线功能。
import itertoolsfrom collections import OrderedDictfrom functools import partialimport numpy as npimport matplotlib.pyplot as pltimport matplotlib.ticker as mtickerfrom cycler import cyclerdef filled_hist(ax, edges, values, bottoms=None, orientation='v',**kwargs):"""Draw a histogram as a stepped patch.Extra kwargs are passed through to `fill_between`Parameters----------ax : AxesThe axes to plot toedges : arrayA length n+1 array giving the left edges of each bin and theright edge of the last bin.values : arrayA length n array of bin counts or valuesbottoms : scalar or array, optionalA length n array of the bottom of the bars. If None, zero is used.orientation : {'v', 'h'}Orientation of the histogram. 'v' (default) hasthe bars increasing in the positive y-direction.Returns-------ret : PolyCollectionArtist added to the Axes"""print(orientation)if orientation not in 'hv':raise ValueError("orientation must be in {{'h', 'v'}} ""not {o}".format(o=orientation))kwargs.setdefault('step', 'post')edges = np.asarray(edges)values = np.asarray(values)if len(edges) - 1 != len(values):raise ValueError('Must provide one more bin edge than value not: ''len(edges): {lb} len(values): {lv}'.format(lb=len(edges), lv=len(values)))if bottoms is None:bottoms = np.zeros_like(values)if np.isscalar(bottoms):bottoms = np.ones_like(values) * bottomsvalues = np.r_[values, values[-1]]bottoms = np.r_[bottoms, bottoms[-1]]if orientation == 'h':return ax.fill_betweenx(edges, values, bottoms,**kwargs)elif orientation == 'v':return ax.fill_between(edges, values, bottoms,**kwargs)else:raise AssertionError("you should never be here")def stack_hist(ax, stacked_data, sty_cycle, bottoms=None,hist_func=None, labels=None,plot_func=None, plot_kwargs=None):"""ax : axes.AxesThe axes to add artists toostacked_data : array or MappingA (N, M) shaped array. The first dimension will be iterated over tocompute histograms row-wisesty_cycle : Cycler or operable of dictStyle to apply to each setbottoms : array, optionalThe initial positions of the bottoms, defaults to 0hist_func : callable, optionalMust have signature `bin_vals, bin_edges = f(data)`.`bin_edges` expected to be one longer than `bin_vals`labels : list of str, optionalThe label for each set.If not given and stacked data is an array defaults to 'default set {n}'If stacked_data is a mapping, and labels is None, default to the keys(which may come out in a random order).If stacked_data is a mapping and labels is given then onlythe columns listed by be plotted.plot_func : callable, optionalFunction to call to draw the histogram must have signature:ret = plot_func(ax, edges, top, bottoms=bottoms,label=label, **kwargs)plot_kwargs : dict, optionalAny extra kwargs to pass through to the plotting function. Thiswill be the same for all calls to the plotting function and willover-ride the values in cycle.Returns-------arts : dictDictionary of artists keyed on their labels"""# deal with default binning functionif hist_func is None:hist_func = np.histogram# deal with default plotting functionif plot_func is None:plot_func = filled_hist# deal with defaultif plot_kwargs is None:plot_kwargs = {}print(plot_kwargs)try:l_keys = stacked_data.keys()label_data = Trueif labels is None:labels = l_keysexcept AttributeError:label_data = Falseif labels is None:labels = itertools.repeat(None)if label_data:loop_iter = enumerate((stacked_data[lab], lab, s)for lab, s in zip(labels, sty_cycle))else:loop_iter = enumerate(zip(stacked_data, labels, sty_cycle))arts = {}for j, (data, label, sty) in loop_iter:if label is None:label = 'dflt set {n}'.format(n=j)label = sty.pop('label', label)vals, edges = hist_func(data)if bottoms is None:bottoms = np.zeros_like(vals)top = bottoms + valsprint(sty)sty.update(plot_kwargs)print(sty)ret = plot_func(ax, edges, top, bottoms=bottoms,label=label, **sty)bottoms = toparts[label] = retax.legend(fontsize=10)return arts# set up histogram function to fixed binsedges = np.linspace(-3, 3, 20, endpoint=True)hist_func = partial(np.histogram, bins=edges)# set up style cyclescolor_cycle = cycler(facecolor=plt.rcParams['axes.prop_cycle'][:4])label_cycle = cycler(label=['set {n}'.format(n=n) for n in range(4)])hatch_cycle = cycler(hatch=['/', '*', '+', '|'])# Fixing random state for reproducibilitynp.random.seed(19680801)stack_data = np.random.randn(4, 12250)dict_data = OrderedDict(zip((c['label'] for c in label_cycle), stack_data))
使用普通数组
fig, (ax1, ax2) = plt.subplots(1, 2, figsize=(9, 4.5), tight_layout=True)arts = stack_hist(ax1, stack_data, color_cycle + label_cycle + hatch_cycle,hist_func=hist_func)arts = stack_hist(ax2, stack_data, color_cycle,hist_func=hist_func,plot_kwargs=dict(edgecolor='w', orientation='h'))ax1.set_ylabel('counts')ax1.set_xlabel('x')ax2.set_xlabel('counts')ax2.set_ylabel('x')
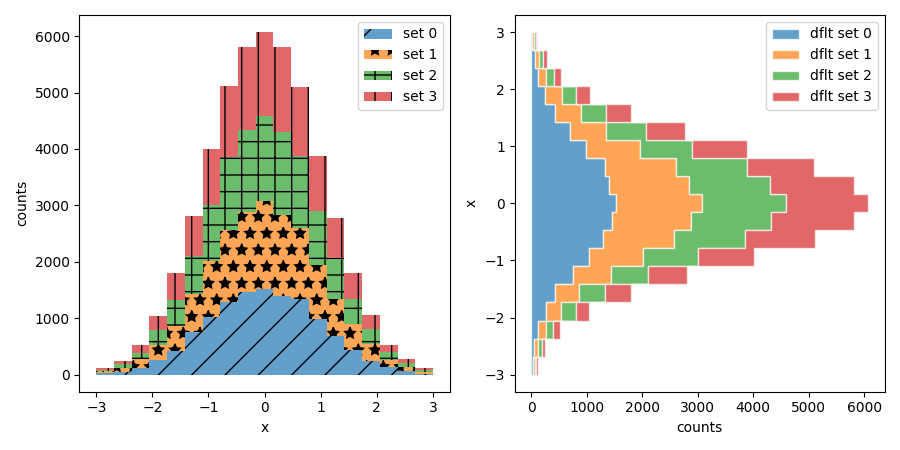
输出:
{}{'facecolor': '#1f77b4', 'hatch': '/'}{'facecolor': '#1f77b4', 'hatch': '/'}v{'facecolor': '#ff7f0e', 'hatch': '*'}{'facecolor': '#ff7f0e', 'hatch': '*'}v{'facecolor': '#2ca02c', 'hatch': '+'}{'facecolor': '#2ca02c', 'hatch': '+'}v{'facecolor': '#d62728', 'hatch': '|'}{'facecolor': '#d62728', 'hatch': '|'}v{'edgecolor': 'w', 'orientation': 'h'}{'facecolor': '#1f77b4'}{'facecolor': '#1f77b4', 'edgecolor': 'w', 'orientation': 'h'}h{'facecolor': '#ff7f0e'}{'facecolor': '#ff7f0e', 'edgecolor': 'w', 'orientation': 'h'}h{'facecolor': '#2ca02c'}{'facecolor': '#2ca02c', 'edgecolor': 'w', 'orientation': 'h'}h{'facecolor': '#d62728'}{'facecolor': '#d62728', 'edgecolor': 'w', 'orientation': 'h'}h
使用标记数据
fig, (ax1, ax2) = plt.subplots(1, 2, figsize=(9, 4.5),tight_layout=True, sharey=True)arts = stack_hist(ax1, dict_data, color_cycle + hatch_cycle,hist_func=hist_func)arts = stack_hist(ax2, dict_data, color_cycle + hatch_cycle,hist_func=hist_func, labels=['set 0', 'set 3'])ax1.xaxis.set_major_locator(mticker.MaxNLocator(5))ax1.set_xlabel('counts')ax1.set_ylabel('x')ax2.set_ylabel('x')plt.show()
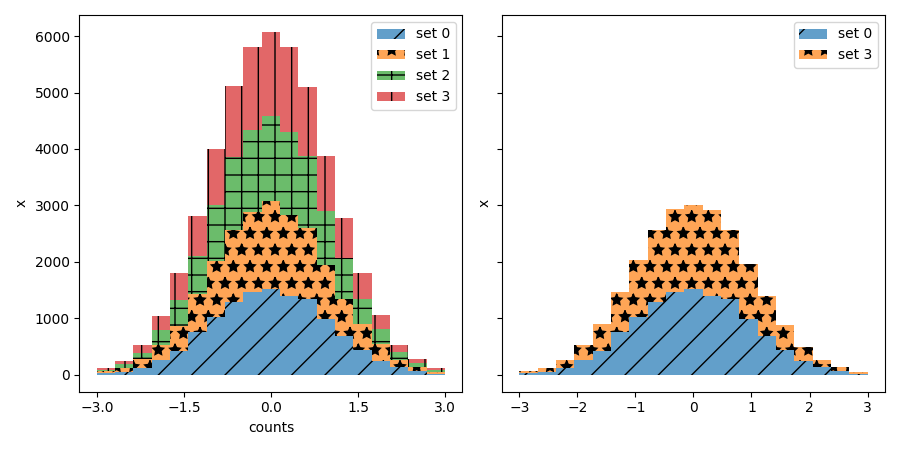
输出:
{}{'facecolor': '#1f77b4', 'hatch': '/'}{'facecolor': '#1f77b4', 'hatch': '/'}v{'facecolor': '#ff7f0e', 'hatch': '*'}{'facecolor': '#ff7f0e', 'hatch': '*'}v{'facecolor': '#2ca02c', 'hatch': '+'}{'facecolor': '#2ca02c', 'hatch': '+'}v{'facecolor': '#d62728', 'hatch': '|'}{'facecolor': '#d62728', 'hatch': '|'}v{}{'facecolor': '#1f77b4', 'hatch': '/'}{'facecolor': '#1f77b4', 'hatch': '/'}v{'facecolor': '#ff7f0e', 'hatch': '*'}{'facecolor': '#ff7f0e', 'hatch': '*'}v
参考
此示例中显示了以下函数,方法,类和模块的使用:
import matplotlibmatplotlib.axes.Axes.fill_betweenxmatplotlib.axes.Axes.fill_betweenmatplotlib.axis.Axis.set_major_locator
下载这个示例

若有收获,就点个赞吧
0 人点赞
