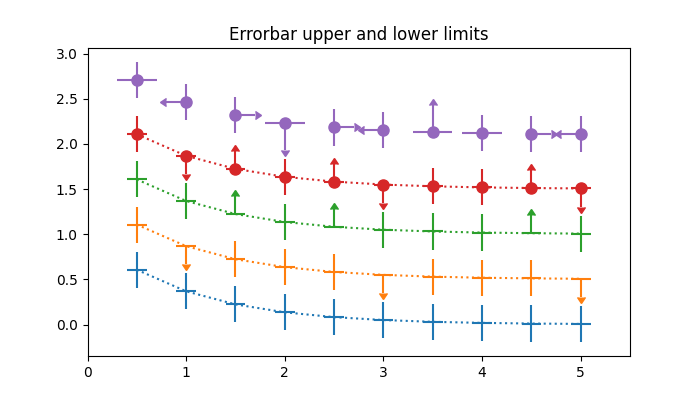
误差条形图中的上限和下限
在matplotlib中,误差条可以有“限制”。对误差线应用限制实质上使误差单向。因此,可以分别通过uplims,lolims,xuplims和xlolims参数在y方向和x方向上应用上限和下限。 这些参数可以是标量或布尔数组。
例如,如果xlolims为True,则x-error条形将仅从数据扩展到递增值。如果uplims是一个填充了False的数组,除了第4和第7个值之外,所有y误差条都是双向的,除了第4和第7个条形,它们将从数据延伸到减小的y值。
import numpy as npimport matplotlib.pyplot as plt# example datax = np.array([0.5, 1.0, 1.5, 2.0, 2.5, 3.0, 3.5, 4.0, 4.5, 5.0])y = np.exp(-x)xerr = 0.1yerr = 0.2# lower & upper limits of the errorlolims = np.array([0, 0, 1, 0, 1, 0, 0, 0, 1, 0], dtype=bool)uplims = np.array([0, 1, 0, 0, 0, 1, 0, 0, 0, 1], dtype=bool)ls = 'dotted'fig, ax = plt.subplots(figsize=(7, 4))# standard error barsax.errorbar(x, y, xerr=xerr, yerr=yerr, linestyle=ls)# including upper limitsax.errorbar(x, y + 0.5, xerr=xerr, yerr=yerr, uplims=uplims,linestyle=ls)# including lower limitsax.errorbar(x, y + 1.0, xerr=xerr, yerr=yerr, lolims=lolims,linestyle=ls)# including upper and lower limitsax.errorbar(x, y + 1.5, xerr=xerr, yerr=yerr,lolims=lolims, uplims=uplims,marker='o', markersize=8,linestyle=ls)# Plot a series with lower and upper limits in both x & y# constant x-error with varying y-errorxerr = 0.2yerr = np.zeros_like(x) + 0.2yerr[[3, 6]] = 0.3# mock up some limits by modifying previous dataxlolims = lolimsxuplims = uplimslolims = np.zeros(x.shape)uplims = np.zeros(x.shape)lolims[[6]] = True # only limited at this indexuplims[[3]] = True # only limited at this index# do the plottingax.errorbar(x, y + 2.1, xerr=xerr, yerr=yerr,xlolims=xlolims, xuplims=xuplims,uplims=uplims, lolims=lolims,marker='o', markersize=8,linestyle='none')# tidy up the figureax.set_xlim((0, 5.5))ax.set_title('Errorbar upper and lower limits')plt.show()
下载这个示例

若有收获,就点个赞吧
0 人点赞
