子图演示大全
说明 plt.subplots() 使用的示例。
此函数只需一次调用即可创建地物和子图网格,同时对各个图的创建方式提供合理的控制。要对子打印创建进行非常精细的调整,仍然可以直接在新地物上使用 add_subplot()。
import matplotlib.pyplot as pltimport numpy as np# Simple data to display in various formsx = np.linspace(0, 2 * np.pi, 400)y = np.sin(x ** 2)plt.close('all')
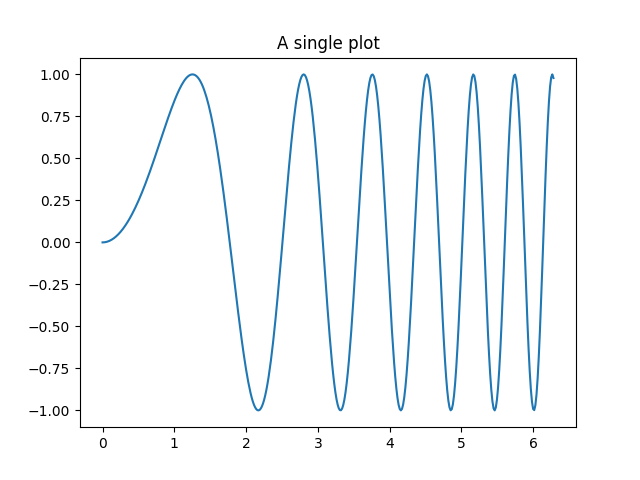
只有一个图形和一个子图
f, ax = plt.subplots()ax.plot(x, y)ax.set_title('Simple plot')
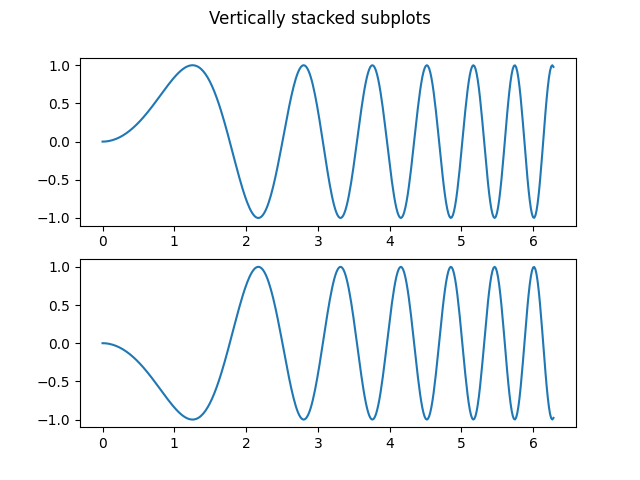
两个子图,轴数组是一维的。
f, axarr = plt.subplots(2, sharex=True)f.suptitle('Sharing X axis')axarr[0].plot(x, y)axarr[1].scatter(x, y)
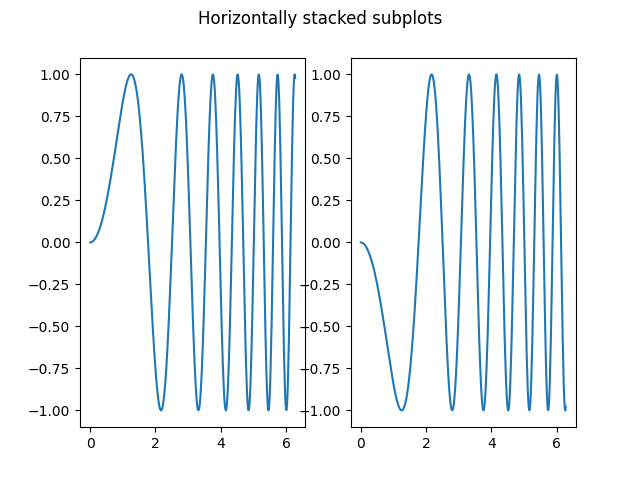
Two subplots, unpack the axes array immediately
f, (ax1, ax2) = plt.subplots(1, 2, sharey=True)f.suptitle('Sharing Y axis')ax1.plot(x, y)ax2.scatter(x, y)

共享x/y轴的三个子图
f, axarr = plt.subplots(3, sharex=True, sharey=True)f.suptitle('Sharing both axes')axarr[0].plot(x, y)axarr[1].scatter(x, y)axarr[2].scatter(x, 2 * y ** 2 - 1, color='r')# Bring subplots close to each other.f.subplots_adjust(hspace=0)# Hide x labels and tick labels for all but bottom plot.for ax in axarr:ax.label_outer()
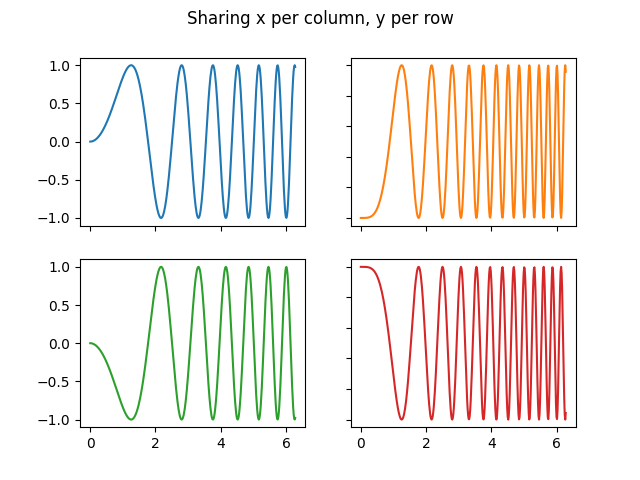
行和列共享
f, ((ax1, ax2), (ax3, ax4)) = plt.subplots(2, 2, sharex='col', sharey='row')f.suptitle('Sharing x per column, y per row')ax1.plot(x, y)ax2.scatter(x, y)ax3.scatter(x, 2 * y ** 2 - 1, color='r')ax4.plot(x, 2 * y ** 2 - 1, color='r')
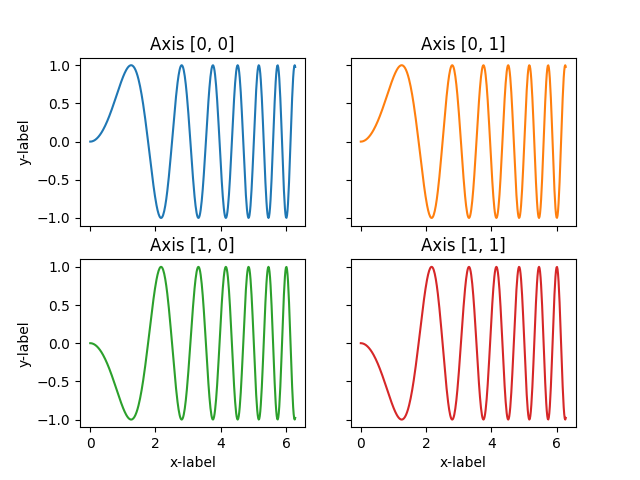
四个轴,作为二维数组返回
f, axarr = plt.subplots(2, 2)axarr[0, 0].plot(x, y)axarr[0, 0].set_title('Axis [0,0]')axarr[0, 1].scatter(x, y)axarr[0, 1].set_title('Axis [0,1]')axarr[1, 0].plot(x, y ** 2)axarr[1, 0].set_title('Axis [1,0]')axarr[1, 1].scatter(x, y ** 2)axarr[1, 1].set_title('Axis [1,1]')for ax in axarr.flat:ax.set(xlabel='x-label', ylabel='y-label')# Hide x labels and tick labels for top plots and y ticks for right plots.for ax in axarr.flat:ax.label_outer()
四极轴
f, axarr = plt.subplots(2, 2, subplot_kw=dict(projection='polar'))axarr[0, 0].plot(x, y)axarr[0, 0].set_title('Axis [0,0]')axarr[0, 1].scatter(x, y)axarr[0, 1].set_title('Axis [0,1]')axarr[1, 0].plot(x, y ** 2)axarr[1, 0].set_title('Axis [1,0]')axarr[1, 1].scatter(x, y ** 2)axarr[1, 1].set_title('Axis [1,1]')# Fine-tune figure; make subplots farther from each other.f.subplots_adjust(hspace=0.3)plt.show()
下载这个示例

若有收获,就点个赞吧
0 人点赞
