3D条形图演示
有关如何使用和不使用着色绘制3D条形图的基本演示。
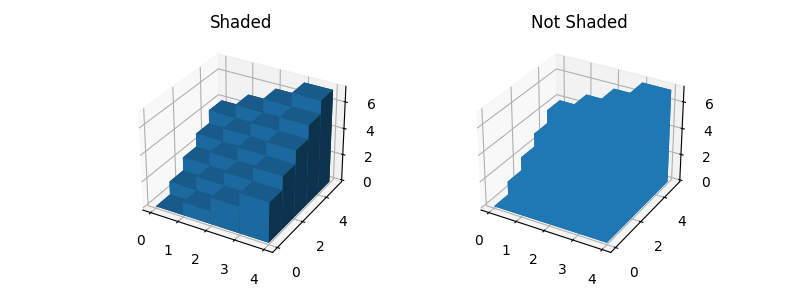
import numpy as npimport matplotlib.pyplot as plt# This import registers the 3D projection, but is otherwise unused.from mpl_toolkits.mplot3d import Axes3D # noqa: F401 unused import# setup the figure and axesfig = plt.figure(figsize=(8, 3))ax1 = fig.add_subplot(121, projection='3d')ax2 = fig.add_subplot(122, projection='3d')# fake data_x = np.arange(4)_y = np.arange(5)_xx, _yy = np.meshgrid(_x, _y)x, y = _xx.ravel(), _yy.ravel()top = x + ybottom = np.zeros_like(top)width = depth = 1ax1.bar3d(x, y, bottom, width, depth, top, shade=True)ax1.set_title('Shaded')ax2.bar3d(x, y, bottom, width, depth, top, shade=False)ax2.set_title('Not Shaded')plt.show()
下载这个示例

若有收获,就点个赞吧
0 人点赞
