三维曲面(颜色贴图)
演示绘制使用coolwarm颜色贴图着色的3D表面。 使用antialiased = False使表面变得不透明。
还演示了使用LinearLocator和z轴刻度标签的自定义格式。
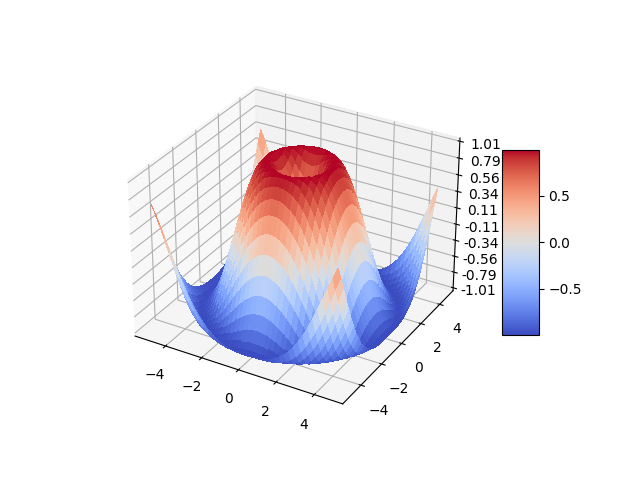
# This import registers the 3D projection, but is otherwise unused.from mpl_toolkits.mplot3d import Axes3D # noqa: F401 unused importimport matplotlib.pyplot as pltfrom matplotlib import cmfrom matplotlib.ticker import LinearLocator, FormatStrFormatterimport numpy as npfig = plt.figure()ax = fig.gca(projection='3d')# Make data.X = np.arange(-5, 5, 0.25)Y = np.arange(-5, 5, 0.25)X, Y = np.meshgrid(X, Y)R = np.sqrt(X**2 + Y**2)Z = np.sin(R)# Plot the surface.surf = ax.plot_surface(X, Y, Z, cmap=cm.coolwarm,linewidth=0, antialiased=False)# Customize the z axis.ax.set_zlim(-1.01, 1.01)ax.zaxis.set_major_locator(LinearLocator(10))ax.zaxis.set_major_formatter(FormatStrFormatter('%.02f'))# Add a color bar which maps values to colors.fig.colorbar(surf, shrink=0.5, aspect=5)plt.show()
下载这个示例

若有收获,就点个赞吧
0 人点赞
